

FarmGPU's in-house KV-cache storage solution runs on our Potato nodes: eight stock 2U servers, each carrying 24 Solidigm D5-P5336 122.88 TB QLC NVMe drives, 23.6 PB of flash in 16 rack units, built the way we think a neocloud's cache tier should be built. We designed it around what KV cache actually asks of storage, which is capacity first and sustained writes second, and we submitted it to MLPerf Storage v3.0 to find out whether the design holds up under a benchmark that was written for exactly that workload.
It does. In the MLPerf® Storage v3.0 KV-cache results, published by MLCommons on September 1, 2026, this solution holds the highest storage density of any disclosed system in the round, scales from one node to eight at 98.8% of perfectly linear in CLOSED division, and in OPEN division posted the highest tokens-per-second figures in the KV-cache field on two of its three workload slots. This post is about the system and why it is shaped the way it is; the benchmark is the evidence. Every number carries its division label and its caveats.
What KV Cache Actually Asks of a Storage Tier
FarmGPU runs GPU infrastructure for AI workloads, and inference is where the fleet spends more and more of its hours. That has given us a long, close look at what KV cache does to the storage underneath it, and the workload is still widely misunderstood.
KV cache is the fastest-growing state in an inference fleet. Every token a model generates leaves behind a key and a value for every layer and every key/value head, and a session keeps that state around so the next token does not have to recompute everything that came before it. For Llama 3.1 8B in bf16 that is 128 KiB per token; for the 70B model, 320 KiB. Long contexts, multi-turn sessions, shared system prompts, and agentic loops that revisit the same prefix hundreds of times all make recomputing that state far more expensive than keeping it. So you keep it, and the question becomes where.
The hottest cache lives in HBM and DRAM. Everything else spills to storage, and here is where the misconceptions start. Teams size that storage tier like a training scratch tier, chasing IOPS and read bandwidth first, or like an archive, chasing the cheapest byte. It is neither. Watched from the storage side, KV cache is a write-once, read-on-prefix-hit, read-in-big-blocks workload with a long tail of entries that are never read at all. The storage tier's job is three things, in this order: hold a very large amount of cache, absorb a continuous write stream without flinching, and serve hits in large sequential reads at a predictable tail latency. Capacity first, writes second, reads third. The moment a memory tier sits in front of the storage, which is how every serious inference stack is built, the read side gets even lighter and the write side becomes the whole job.
That is the drift we have been steering toward for a while now: a KV-cache tier is a capacity-and-writes problem, not a throughput problem. Once you see it that way, the design writes itself.
Why That Points a Neocloud at QLC
Ask around and you will hear that QLC is capacity media. Cold tier, nearline, archive flash. Fine for data you write once and mostly leave alone, wrong for anything hot, mixed, or unforgiving. KV cache, with its relentless write stream, is supposed to be exactly the workload QLC cannot touch.
We see it the other way around, and the reason is what we are. FarmGPU is a neocloud. We sell GPU hours. Every rack unit that holds storage instead of accelerators, and every watt that feeds a drive instead of a GPU, comes straight out of the product we exist to sell. So when we run the TCO math on a cache tier, dollars per terabyte is the third question. The first two are terabytes per rack unit and terabytes per watt, because those are the numbers that decide how many GPUs fit in the building.
That lens changes which drive you want. A 122.88 TB QLC drive is not "good enough" for a KV-cache tier; it is the reason the tier can live inside the compute footprint at all. Twenty-four of them turn a stock 2U server into a 2.95 PB cache node that runs off one 1,600 W supply. At that point capacity stops being the constraint you design around, and the question flips from "how do we get enough capacity" to "how few rack units and how few watts can we spend getting it." 120 TB class drives, and the larger ones behind them, are more than enough. What is left to optimize is footprint and power, and QLC wins both by a wide margin.
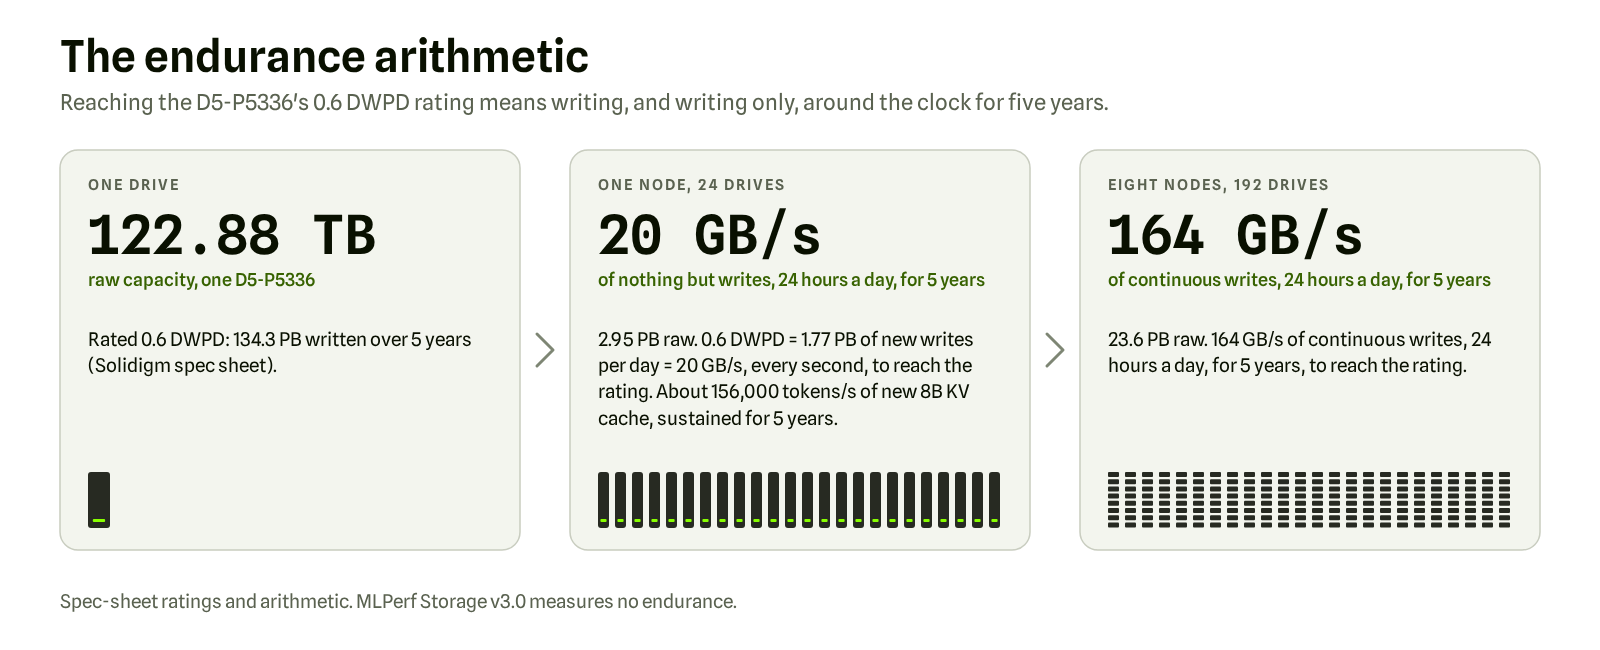
Then there is endurance, the objection everyone raises. Endurance is a ratio: bytes written divided by drive capacity. Put 2.95 PB behind one node and that ratio changes character. The D5-P5336 122.88 TB is rated on its spec sheet at 0.6 drive writes per day, 134.3 PB written per drive over its five-year warranty. Scale that to one Potato node and the endurance budget is 1.77 PB of new data every day: 20 GB/s of nothing but writes, every second, around the clock, for five years, before the rating is reached. To be clear about what that 20 GB/s is: it is the write budget implied by the 0.6 DWPD rating, not a throughput limit. The node's spec-sheet write ceiling is about 72 GB/s.
At 128 KiB per token, that budget is roughly 156,000 tokens per second of brand-new 8B KV cache landing on one node, sustained for five years with no idle time and no cache hits. For the eight-node fleet, the budget is 164 GB/s, continuously, for five years. No inference workload does that. A KV-cache tier's write stream is bounded by how fast the GPUs in front of it produce tokens, every byte written is a byte the same interface is not spending on the cache-hit reads that justify the tier's existence, and the writes themselves are large sequential blocks, the pattern QLC handles best. You cannot push that much data into the tier while also using it for what you bought it for. The wall this design hits first is bandwidth, not wear, and the node below puts enough of it in each rack unit that the wall is a long way off.
Put that budget in GPUs. Blackwell and Blackwell Ultra systems posted roughly 18,000 to 20,000 tokens per second per GPU on Llama 3.1 8B in the MLPerf Inference offline scenario, the batch-everything, no-latency-target number that is the most a GPU will ever produce. At that rate, spending one Potato node's endurance budget takes an entire 8-GPU B300-class server: all eight GPUs at offline peak, every second of every day for five years, with every token any of them ever generates written to the storage tier as new cache and not one served back from memory. Saturating the whole fleet's 164 GB/s takes eight of those servers, about 64 GPUs, under the same never-happens conditions. On a 70B-class model the arithmetic tightens to roughly five GPUs per node, since each token carries 2.5x the cache while the GPU produces them at about 70% of the 8B rate, and it still only holds under those same conditions. Real fleets do not look like that. GPUs run against latency targets at a fraction of offline peak, they idle, the hottest cache stays in HBM and DRAM, prefix hits are served rather than rewritten, and short sessions live and die without their cache ever touching storage. Even the pathological case lands on the five-year rating rather than past it, and every one of those real-world factors pushes the horizon further out.
That is the thesis. The hardware to test it was already racked in our fleet.
What's in the Boxes
Every Potato node is identical, and every part of it is off the shelf.
| Component | Specification |
|---|---|
| Chassis | Supermicro SYS-212H-TN, 2U |
| CPU | 1x Intel Xeon 6781P (Xeon 6, 80 cores) |
| Memory | 512 GiB DDR5 installed (503 GiB available to the OS) |
| Storage | 24x Solidigm D5-P5336 122.88 TB QLC NVMe, PCIe 4.0 x4 (SKU SBFPF2BV0P12) |
| Raw capacity per node | 2,949.12 TB nominal (about 2.95 PB); df reports 2,682.7 TiB usable on XFS |
| Array | One md RAID-0, 512K chunk, XFS, mounted at /mnt/qlc |
| Network | 2x NVIDIA ConnectX-7 400GbE |
| Power | 1x 1,600 W PSU active per node (nameplate; no measured power exists in MLPerf Storage v3.0) |
| OS | Ubuntu 24.04.3 LTS, kernel 6.8.0-134-generic, with mainline md and XFS |
Eight of those make the fleet: 192 drives, 23,592.96 TB raw (23.6 PB; df across the eight nodes reports 21,461.8 TiB usable), 16 rack units, 12.8 kW of nameplate PSU capacity. Because the arrays are RAID-0 on XFS, usable capacity is within a rounding error of raw, which matters when you are the one paying for the rack. If you convert and find df a hair above nominal (2,949.12 TB is 2,682.2 TiB; df says 2,682.7), that is because the drives' formatted capacity runs slightly above the nominal 122.88 TB.
Seven of these same nodes also appear in our Hickory submission as client hosts, with their local QLC excluded from that system under test. Here, all eight Potato nodes are the system under test, and the QLC is the whole point.
RAID-0 is a performance configuration. There is no drive-level redundancy in the tested arrays. Production deployments provide durability at the application or replica layer, and a KV cache, which can always be regenerated from the prompt, is one of the few tiers where that is exactly the right trade.
Before any of the benchmark work, an fio pass across the eight nodes read 888 GB/s of aggregate sequential read. We treat it only as a rough raw-hardware baseline: a FarmGPU lab number, not an MLPerf result, and not comparable to any MLPerf figure in this post.
The Drive That Makes the Node
Everything in the previous section follows from one part. The Solidigm D5-P5336 is a 122.88 TB QLC NVMe drive in a standard 2.5-inch U.2 form factor on a PCIe 4.0 x4 interface, and it is the highest-capacity drive disclosed anywhere in MLPerf Storage v3.0. On the spec sheet it reads at 7,000 MB/s sequential and writes at 3,000 MB/s sequential, is rated at 0.6 drive writes per day (134.3 PB written) over a five-year warranty, and draws 24 W active and 5 W idle.
Those last two numbers are the neocloud numbers. Twenty-four of these drives are 576 W active for 2.95 PB, under 200 W per petabyte at the drive level before you count the server around them, and 120 W when the shelf is idle. Capacity per slot is what lets the tier fit in 2U; watts per petabyte is what lets it fit in the power budget of a building that would rather spend every kilowatt on GPUs. No other drive in the benchmark puts this much capacity behind a single slot, and that one fact shapes every design decision that follows. Every byte of storage in every one of our KV-cache submissions is this drive.
Architecture: A Node Built Around the Cache
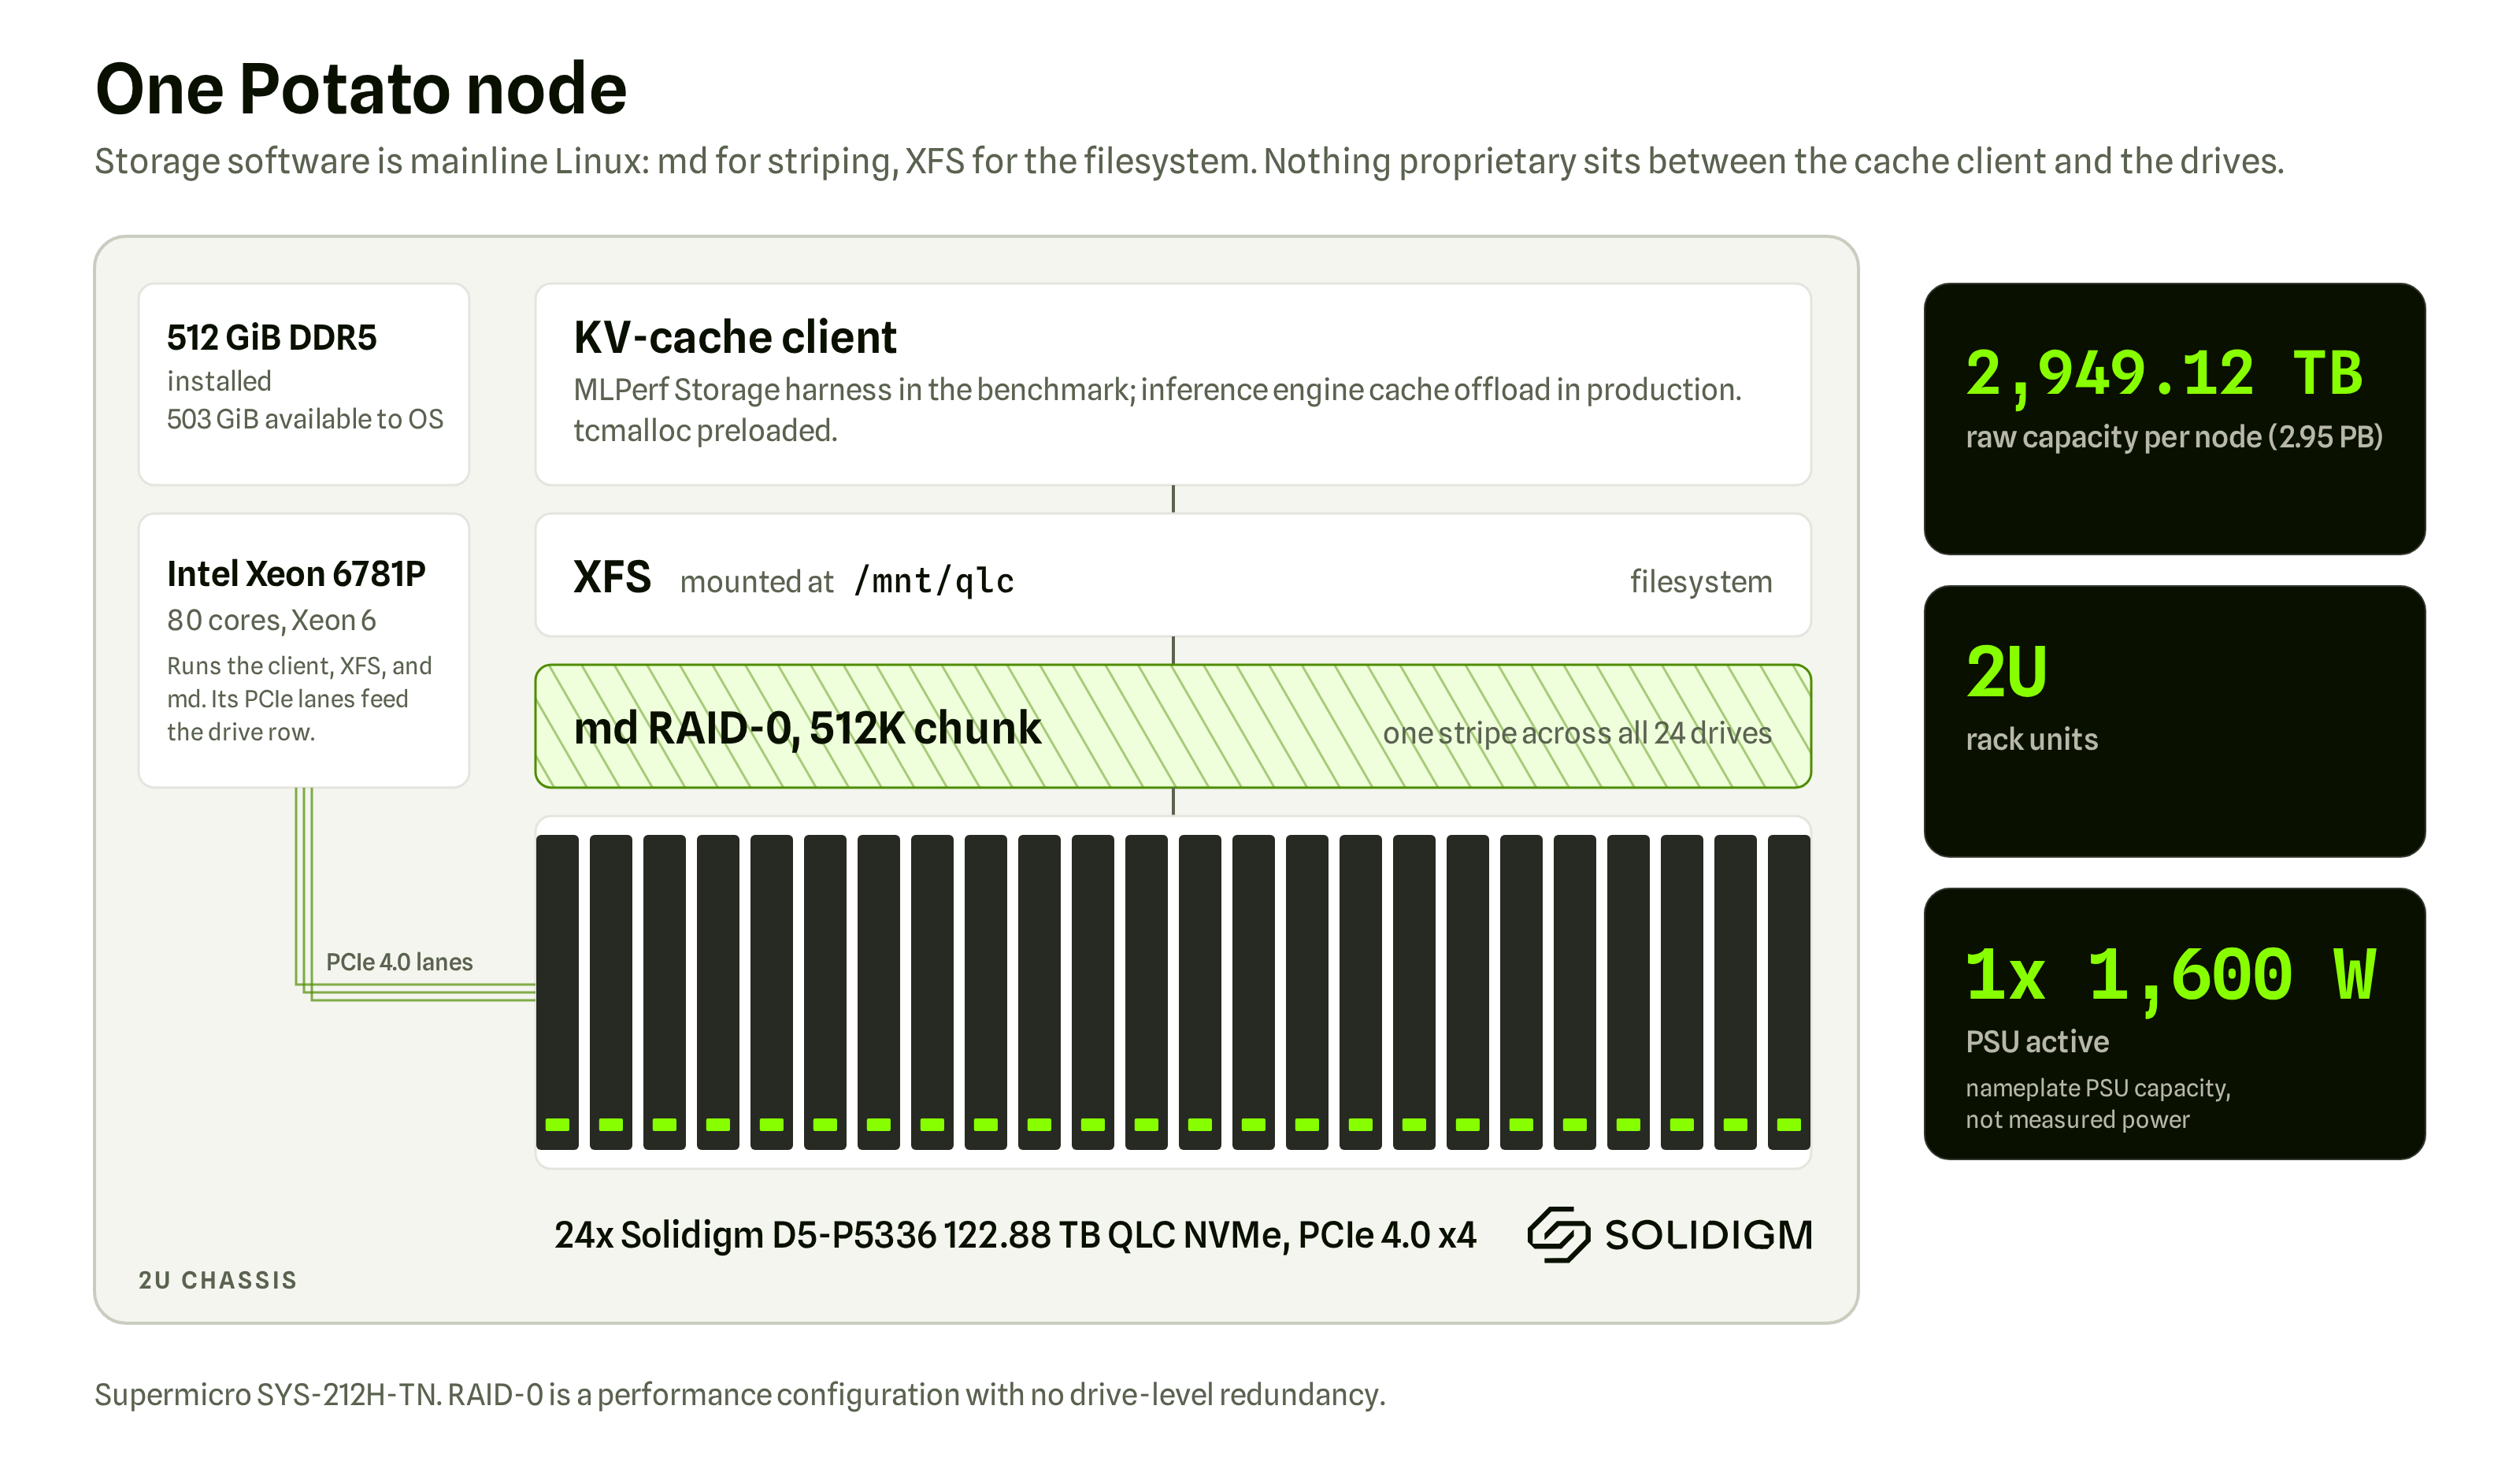
Everything in the node exists to serve the three-part job description above, and everything that does not serve it was left out. There is no appliance, no proprietary client driver, no metadata service, no license key. The storage software stack is what ships with mainline Linux: md for striping, XFS for the filesystem. We wanted the drives to be the story, and this is about as far out of the way as software gets.
The design choices are simple ones made on purpose. Twenty-four drives per node is the density that makes 2U a petabyte-class cache node and puts enough PCIe lanes of flash behind each CPU to matter. RAID-0 with a 512K chunk keeps the stripe wide enough that a single large KV-cache read fans out across the whole shelf of drives rather than serializing on one or two, and it lets the write stream land across all 24 devices at once, which is what keeps sustained ingest smooth on QLC. XFS is there because it is boring and fast on big sequential files, which is what KV-cache blocks are. The array and the filesystem are system configuration, declared as such in every submission.
Network: One Hop From the GPUs
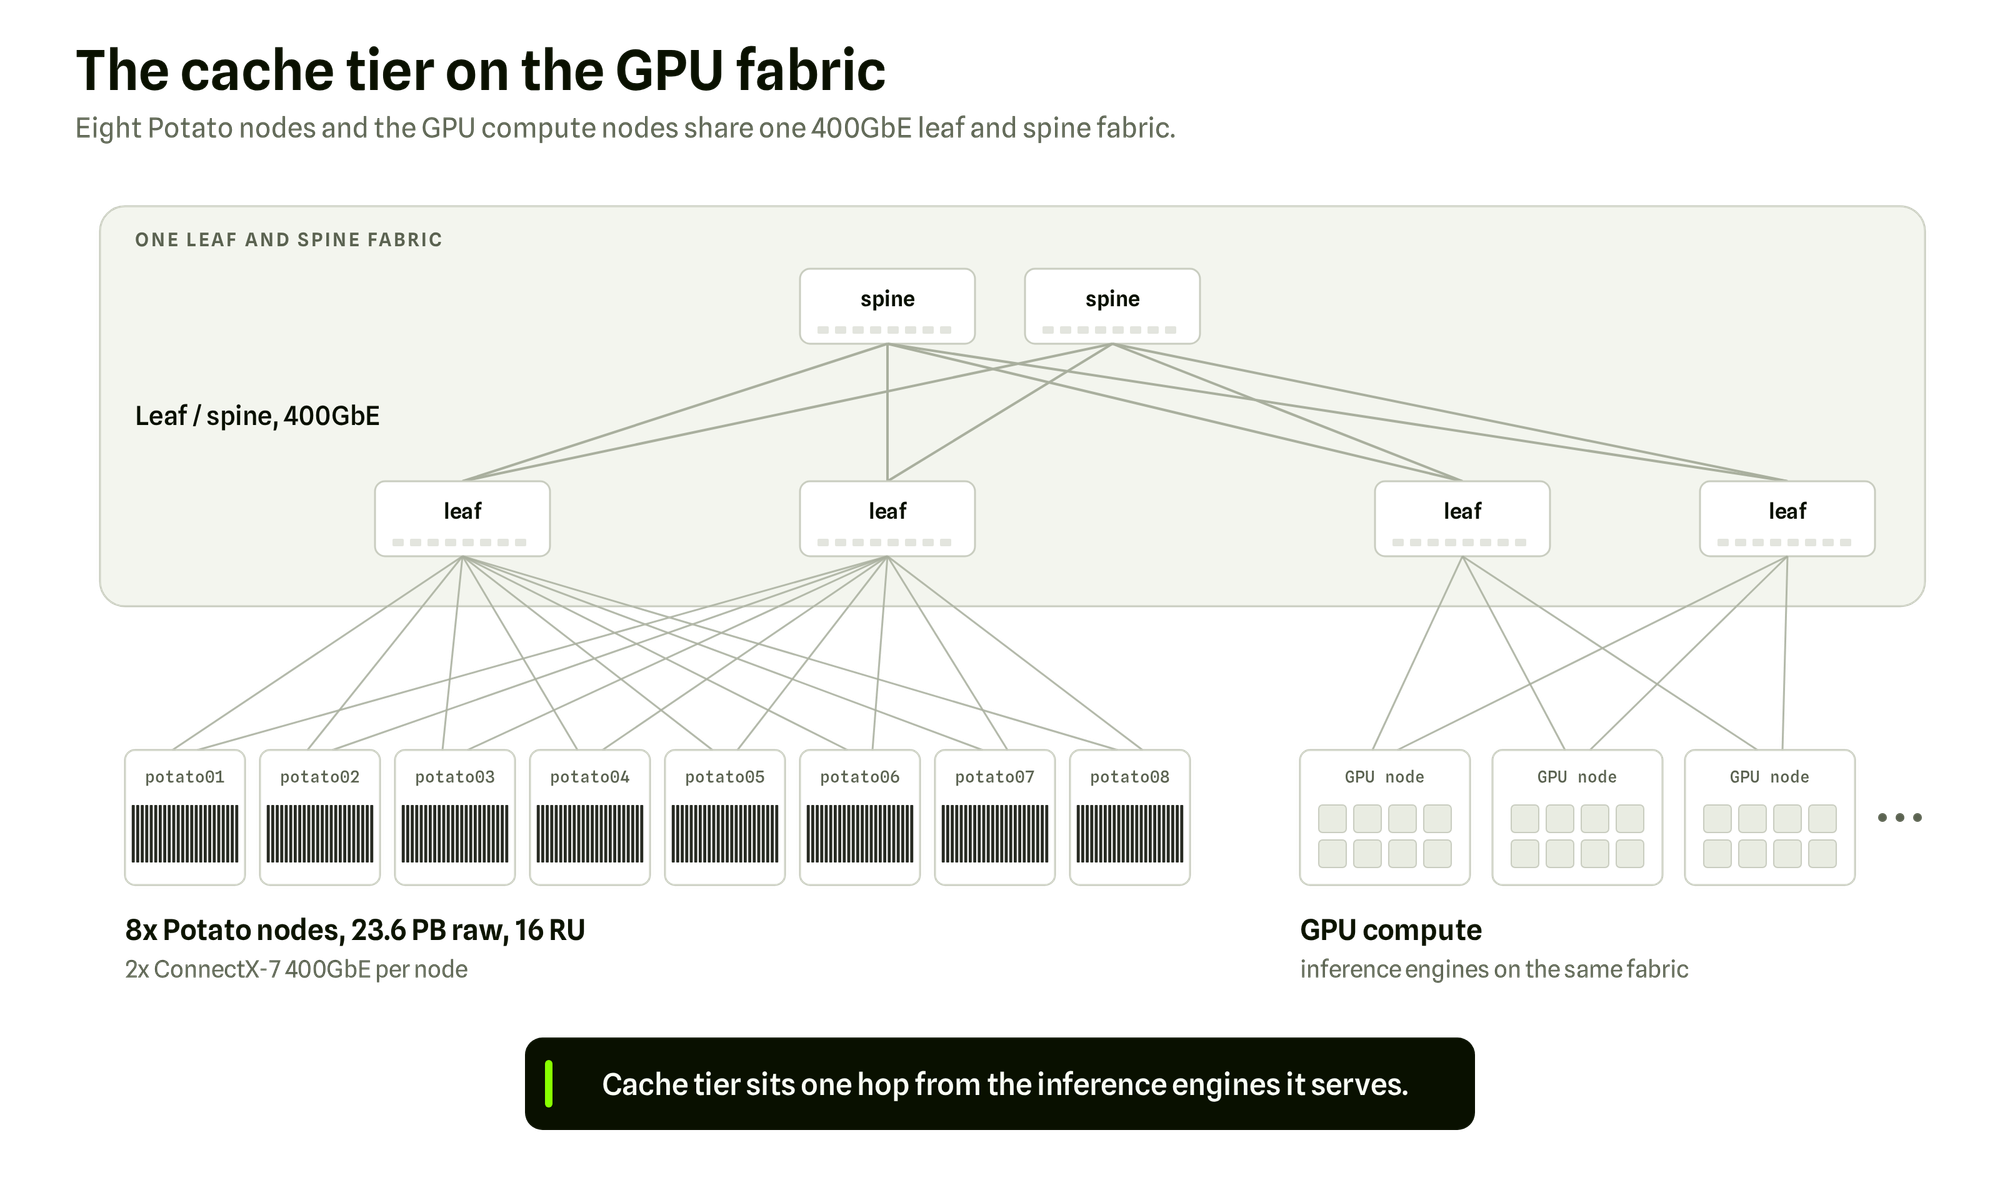
Each Potato node carries two ConnectX-7 400GbE ports into the same leaf-and-spine fabric as FarmGPU's GPU compute, so the cache tier sits one hop from the inference engines whose state it holds. There is no separate storage fabric to build, license, or debug; the tier lives on the network the GPUs already have. In the benchmark, the MLPerf harness coordinates its ranks across this same network.
That placement is a deliberate part of the design. A neocloud's network is sized for the GPUs, and a cache tier that demanded its own fabric would be spending switch ports and rack units the same way an appliance spends them. Growing the tier means racking another identical node onto the existing fabric, and it brings its own capacity and its own bandwidth with it.
MLPerf Storage v3.0: What the Benchmark Measured
MLPerf® Storage v3.0 is MLCommons' AI storage benchmark (mlcommons.org, results published September 1, 2026): 143 published results from 19 organizations across training, checkpointing, and KV-cache workloads, 22 of them KV-cache. CLOSED division fixes parameters so results are directly comparable across submitters. OPEN division allows tuning and forfeits that comparability, so every OPEN figure below carries its label in the same sentence and is reported as a figure posted, never as a leaderboard rank.
The KV-cache benchmark models exactly the workload described at the top of this post: the storage tier absorbs cache writes as new context is generated and serves cache-hit reads as prior context is reused. It scores storage-tier tokens per second, read and write bandwidth, and P95 read latency, which here and throughout this post means the max of per-rank P95s at the POSIX boundary, a worst-client bound, storage tier only. Each submission reports three workload slots: 8B storage-only, 8B storage+mem (a memory tier in front of storage), and a third slot whose CLOSED definition is the 70B model.
We submitted five configurations of the solution, all KV-cache:
| Configuration | Public ID | Division | Nodes | Ranks per node | Notes |
|---|---|---|---|---|---|
| potato1 | v3.0-0035 | CLOSED | 1 | 1 | tcmalloc |
| potato8 | v3.0-0036 | CLOSED | 8 | 1 | tcmalloc |
| potato8-np2 | v3.0-0037 | CLOSED | 8 | 2 | tcmalloc |
| potato8-np6 70b | v3.0-0142 | OPEN | 8 | 6 | tcmalloc, page-cache shim; 70B model, all three slots, 200 users per rank |
| potato8-np6 u400 | v3.0-0143 | OPEN | 8 | 6 | tcmalloc, page-cache shim; 8B model, all three slots, 400 users per rank |
One item in that table deserves its own paragraph, because it drew a question in review and we would rather answer it here than in a footnote. Every one of our runs, CLOSED and OPEN, loads tcmalloc into the benchmark client process via LD_PRELOAD. tcmalloc is Google's thread-caching memory allocator; swapping it in replaces the C library's malloc for that process and nothing else. It does not touch the I/O path, cache any data, alter what is written to or read from the drives, or change a single benchmark parameter. Its effect is to keep a heavily multi-threaded client from spending its time contending for the allocator lock, so the storage under test is what the benchmark measures. It is client-side software configuration, declared in the system description of every submission, and it is the only client-side tuning present in our CLOSED runs. The question came up during results review, as it should have; the runs are published as CLOSED with the allocator declared.
The Density Chart Isn't Close
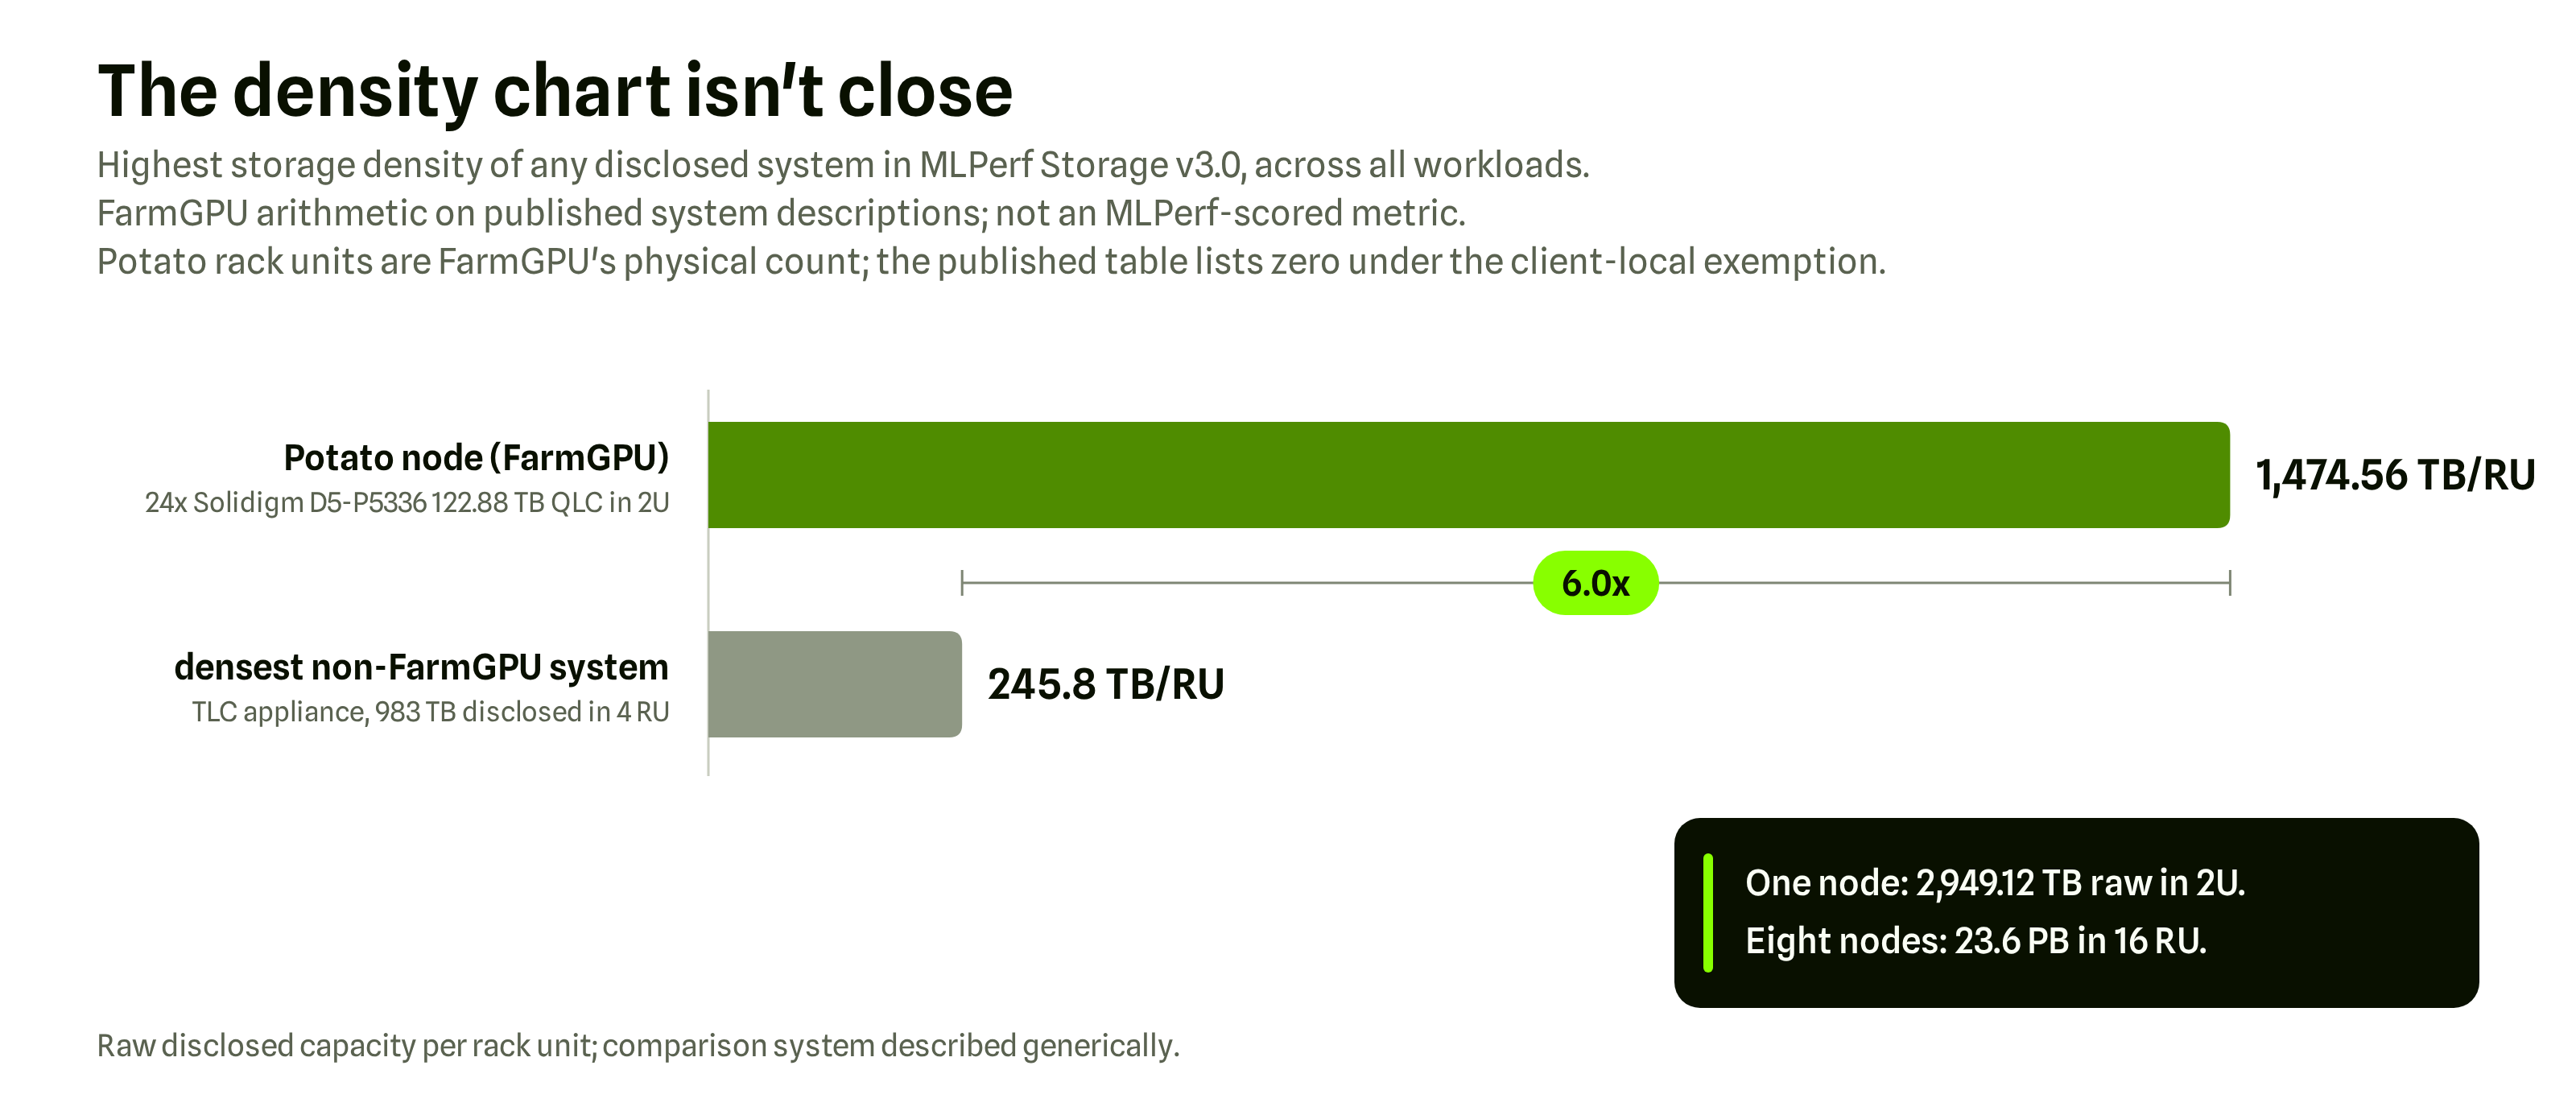
One Potato node packs 2.95 PB of raw QLC into 2U. That is 1,474.56 TB per rack unit, the highest storage density of any disclosed system in MLPerf Storage v3.0, across every workload in the round, and 6.0x the densest non-FarmGPU system in the field, a TLC appliance at 245.8 TB per rack unit (983 TB disclosed in 4 rack units). Not the densest QLC system. Not the densest system in its class. The densest disclosed system, full stop. Capacity first: that is the job description, and this is what taking it seriously looks like.
One honest note on where that number comes from. Density is not a metric MLPerf Storage scores. It is FarmGPU's arithmetic on the capacity and rack-unit fields each submitter disclosed in its published system description, and it covers only systems that disclosed both. If you look these submissions up in the published table you will see zero rack units, because the benchmark exempts client-local storage from its rack-unit rule; the 16U here is our physical count, two per chassis, eight chassis.
At eight nodes, the fleet holds the largest disclosed capacity in the entire KV-cache field. On the raw throughput chart for 8B storage-only, its CLOSED result of 15,522 tok/s has systems above it, and we will say that out loud, because look at what sits above it: every non-FarmGPU CLOSED system that beat that number disclosed under a petabyte of capacity, against this fleet's 23.6 PB. (One FarmGPU system also beat it: our Hickory cluster, a separate submission with its own write-up.)
Scaling You Can Plan a Rack Around
From one node to eight, CLOSED throughput on 8B storage-only scaled 7.91x (98.8% of perfectly linear) and read bandwidth scaled 7.57x, from 32.8 GiB/s to 248.5 GiB/s. For a neocloud, that linearity is the number that matters most in this section: it means the cache tier can be sized in units of "one more node," with capacity and bandwidth arriving together and no surprise cliff in the middle of a build-out.
P95 read latency grew from 2,101 ms at one node to 5,240 ms at eight, and we print that because celebrating the scaling without it would be cheating. Two things square it with the "predictable tail latency" in our job description. First, this P95 is the slowest of eight clients under the benchmark's saturating offered load, not a typical read: per-node throughput held at 98.8% of linear, so the tier did not slow down as it grew; the metric reports the worst of more clients, and it gets stricter as the client count rises. Second, in production a memory tier sits in front of this storage and serves the hot reads, so the storage tier's tail is paid on spill reads, not on every token. Predictable means you can size for it, and this number is exactly what lets you.
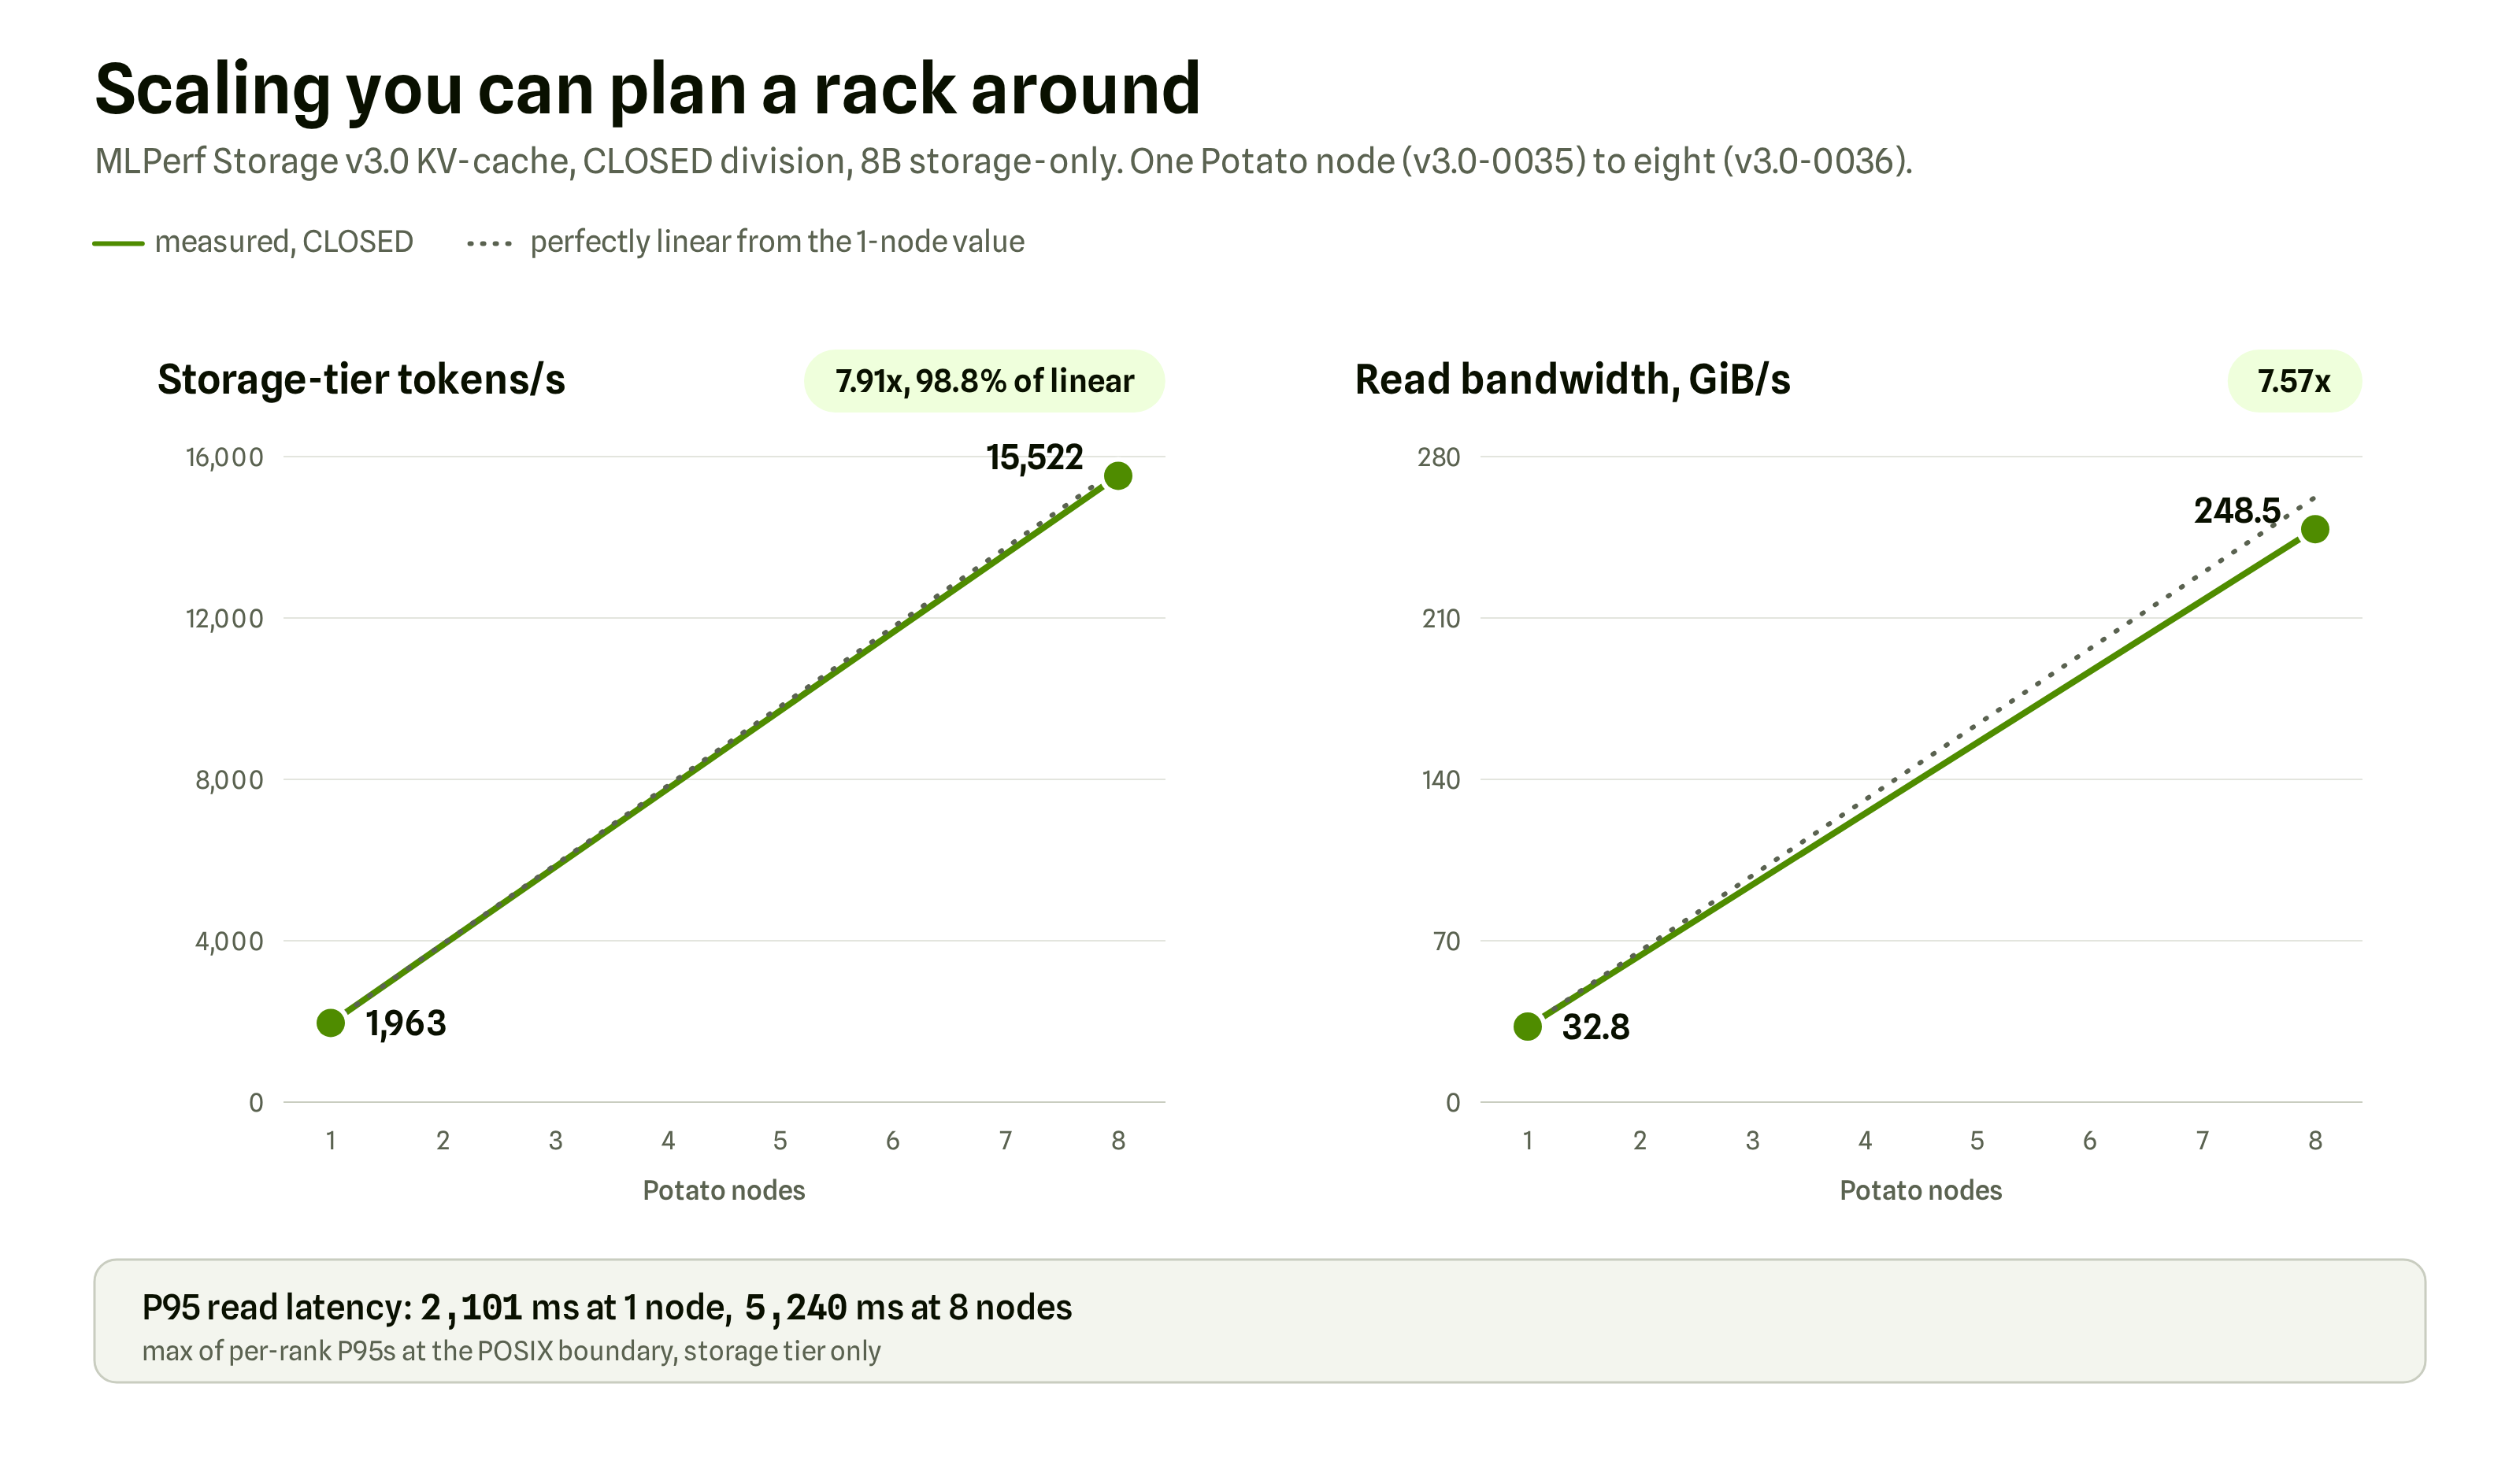
Even a single node holds its own. One node, 24 drives, delivered 1,963 tok/s and 32.8 GiB/s of KV-cache read at a 2,101 ms P95 in CLOSED division on 8B storage-only, while holding 2.95 PB raw.
Eight Nodes Against Fifty-One
Per-client throughput is where this design flexes. Each client in the CLOSED eight-node fleet, at one MPI rank per node, sustained 1,940 tok/s on 8B storage-only: 15% more per client than the raw-throughput leader's 51-client CLOSED run (1,681 tok/s per client). That leader, a scale-out file appliance, tops the raw chart on this slot at 85,736 tok/s, and it gets there with 51 client hosts running 4 MPI ranks each, 4x this fleet's offered users per client, while disclosing about 525 TiB of usable capacity. More clients, more load per client, and still fewer tokens per client than eight FarmGPU nodes on Solidigm QLC.
The Part Where QLC Keeps Up
Now the media story, since that is the reputation on trial.
Tail latency first. This 24-drive QLC node's 8B storage-only P95 of 2,101 ms lands within 4.5% of the comparable single-node, 24-drive TLC system's 2,012 ms, while carrying 19.2x the raw capacity (2,949.12 versus 153.6 TB). Two caveats we are happy to print: that TLC comparator also posted 2.07x this node's tokens per second on the slot, and the field-best P95 anywhere on this slot is 1,224 ms, from a 4-node tiered TLC system. This is latency parity with the like-for-like 24-drive TLC node at 19x the capacity, not a field-leading latency claim. For "archive media," parity with TLC at that capacity multiple is the headline.
Then the workload shape that matters in production, the one we opened this post with. Real inference stacks put a memory tier in front of storage, and the benchmark's 8B storage+mem slot models exactly that. In our runs on that slot, the DRAM tier served about 98% of the reads, leaving the storage tier the write stream and the misses: the capacity-and-writes job this whole design is built for. On that slot in CLOSED division, the eight-node fleet sustained 14,839 tok/s at two ranks per node, up 77% from 8,374 at one rank per node, on a storage tier that was doing almost nothing but absorbing writes. One reading note: the benchmark mandates different user counts per slot (100 and 200 per rank), so tokens per second is never compared across slots, here or anywhere else in this post. The QLC fleet kept doing the job the memory tier left it, and this is the result we would point any neocloud at before any other number in the benchmark.
OPEN Division: The Ceiling on the Same Hardware
OPEN division permits what CLOSED forbids: parameter tuning, more MPI ranks, a different offered load. Our OPEN u400 submission ran the same eight nodes at six ranks per node (48 total) with tcmalloc and a page-cache shim. The benchmark's NVMe backend normally drops the page cache before every read; this shim, declared in the submission and permitted only in OPEN, lets the OS cache serve repeat reads. Every OPEN figure below is therefore application-observed rather than guaranteed media traffic, OPEN runs are single 60-second trials against CLOSED's three 300-second trials, and OPEN explicitly forfeits comparability with CLOSED. With all of that on the table:
On 8B storage+mem, this OPEN configuration posted 75,975 tok/s, the highest tokens-per-second figure in the entire KV-cache field, above the best CLOSED figure of 67,642. On the third workload slot it posted 73,744 tok/s, also the highest figure in the field (that slot ran the 8B model at 400 users per rank, not the 70B its column label implies, so it is never model-matched against other submitters' actual 70B runs). On 8B storage-only it posted 75,568 tok/s, second-highest in the field, behind a single 51-client CLOSED run (85,736), with eight client nodes against their 51. Offered load differs between CLOSED and OPEN, so these are figures posted, not tok/s-at-equal-load rankings.
Per client, the OPEN configuration posted the highest tokens-per-second figures in the field on all three slots, all on the 8B model: 9,446 on 8B storage-only, 9,497 on 8B storage+mem, 9,218 on the third slot. That is 5.6x the raw-throughput leader's CLOSED per-client figure (1,681).
Our second OPEN row, v3.0-0142, ran the actual llama3.1-70b model in all three slots, and only its third slot completed with a full 48-of-48 rank result set; the first two slots are missing rank result sets, and their published figures reflect that. On the complete slot, the eight nodes delivered 888.8 GiB/s of KV-cache read bandwidth, 298.5 GiB/s of writes, and 30,896 tok/s at a P95 of 21,439 ms, at 200 users per rank. That 888.8 GiB/s (about 954 GB/s) is application-observed bandwidth at the POSIX boundary, not a measurement of the drives: with the page-cache shim in place, repeat reads are served from the 503 GiB of DRAM in each node, so the harness observes more bandwidth than the media alone supplies. That is exactly what the shim was declared to do, and it is why OPEN bandwidth is reported as application-observed rather than media traffic. It is supporting evidence, not a headline.
And the headroom number. Changes permitted only in OPEN division (six ranks per node instead of one, tcmalloc, the page-cache shim, and offered load raised to 400 users per rank) took identical hardware from 15,522 tok/s CLOSED to 75,568 tok/s OPEN on 8B storage-only: 4.87x with zero hardware modification. Offered load changed too, so this is a software-and-configuration gain on identical hardware, not a software-only gain at equal load. Either way, the drives were never the ceiling.
Back to the TCO Math
Here is where the neocloud lens closes the loop. The fleet that posted the numbers above occupies 16 rack units and 12.8 kW of nameplate PSU capacity, one 1,600 W supply per 2.95 PB. That works out to about 540 W of nameplate capacity per petabyte and 1,474.56 TB per rack unit, and both figures were set by the drive before we touched a config file.
One thing you will not find here is tokens per watt. MLPerf Storage v3.0 measures no power, and MLCommons' results guidelines bar submitters from deriving efficiency figures from nameplate ratings, so we stop at the two numbers the hardware itself sets: 12.8 kW of PSU capacity behind 23.6 PB, and every benchmark figure above produced inside that envelope. That envelope is the number a neocloud has to answer for.
None of that came from a storage vendor's flagship array or a one-off benchmark build. This solution is one cluster in FarmGPU's fleet, built on Potato nodes: stock 2U servers, Solidigm QLC, md RAID-0 and XFS from mainline Linux, on the 400GbE network the GPUs already use. KV-cache storage at petabyte scale turned out to need one special ingredient, a 122.88 TB QLC drive dense enough to make a 2U server a petabyte-class cache node, and one uncommon one: a team that had already worked out what the workload actually asks for. Everything else is restraint.
Solidigm, Intel, and FarmGPU
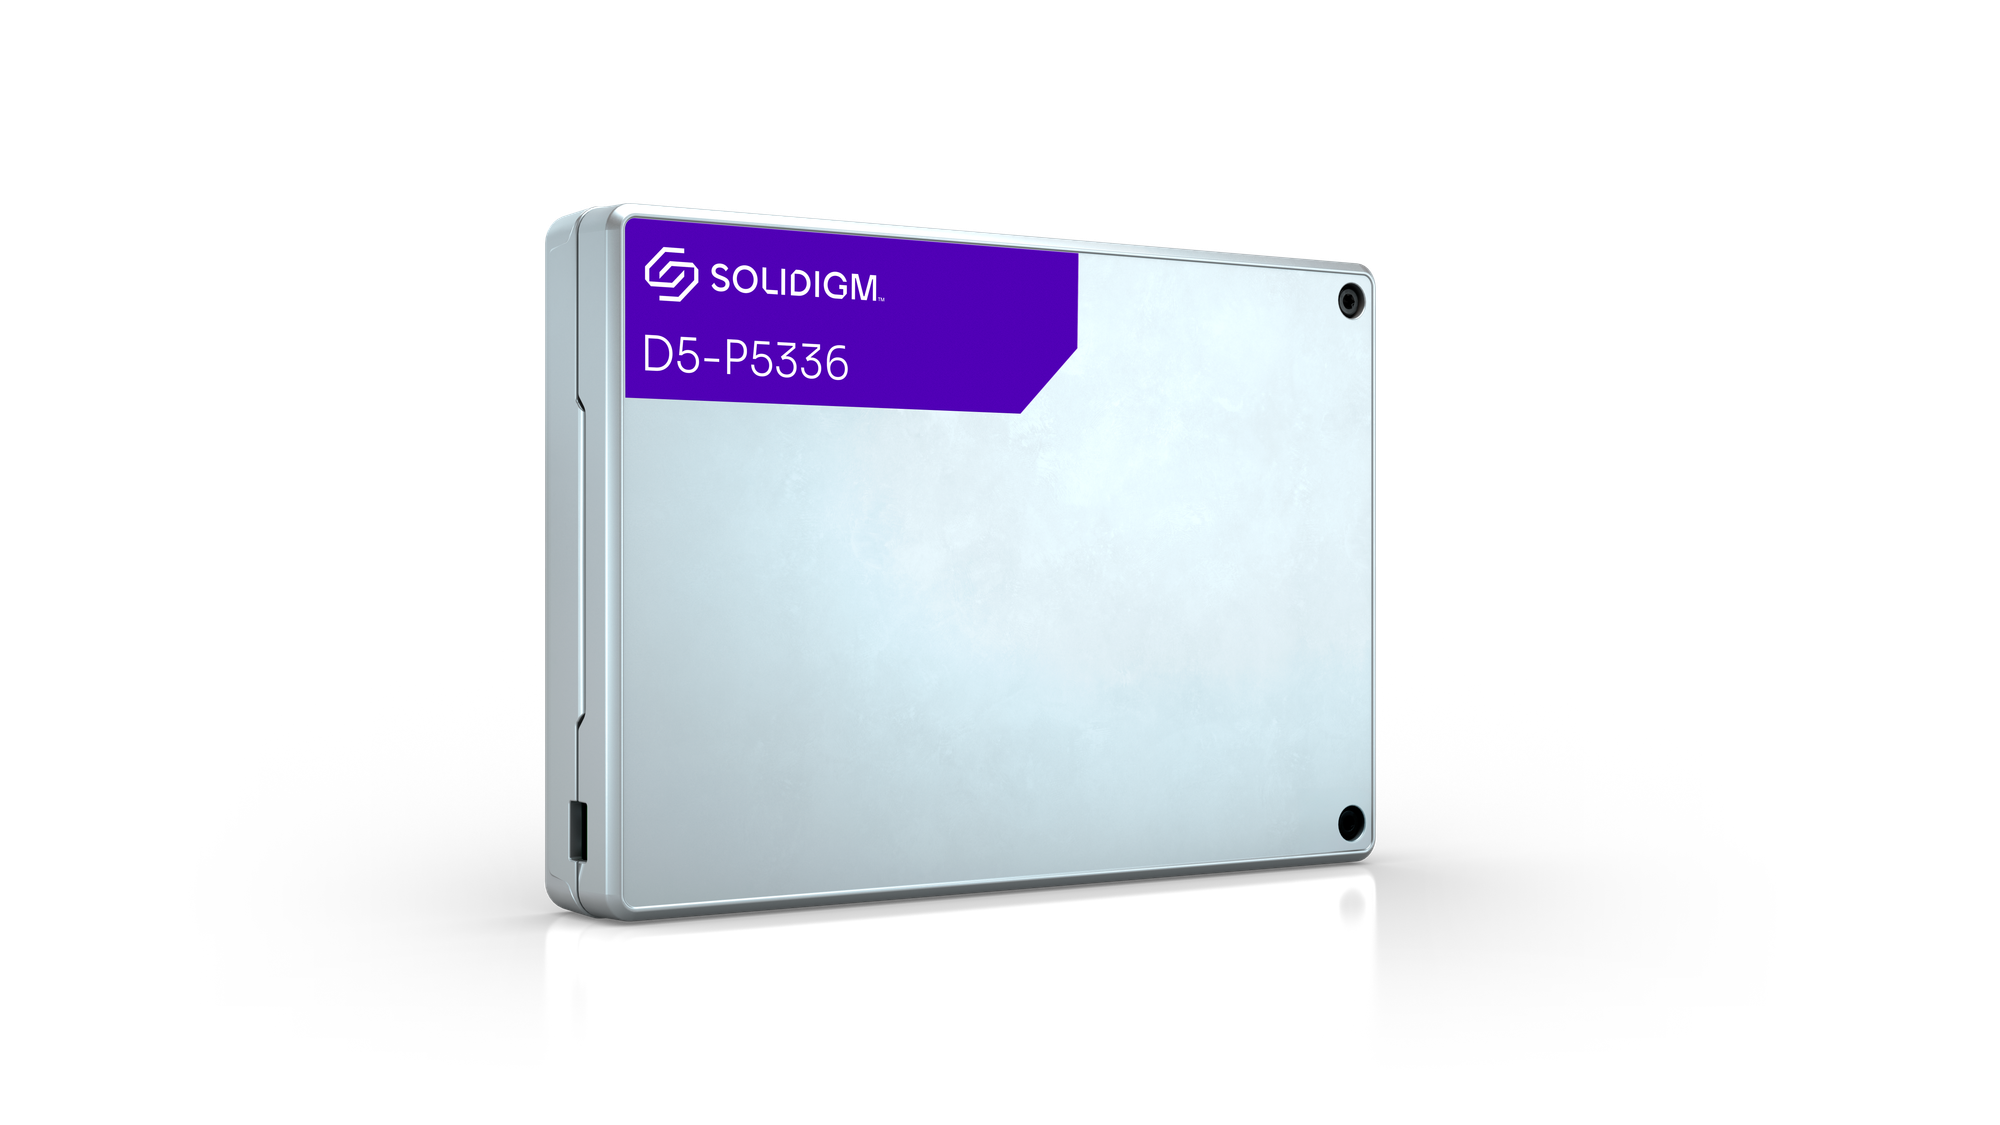
These results exist because Solidigm's D5-P5336 puts 122.88 TB of raw NVMe capacity behind a single drive slot, the density that makes a petabyte-class cache node possible in 2U. Every byte of storage in every one of these submissions is Solidigm QLC. The nodes run on Intel Xeon 6 processors. FarmGPU's storage engineering team designed the node and fleet configuration, built the submission, and ran it end to end.
Full results are published by MLCommons as part of MLPerf Storage v3.0, September 1, 2026.
A Note on Methodology
Every figure above names its workload slot (8B storage-only, 8B storage+mem, or the third slot) and its division. CLOSED fixes parameters for direct comparability; OPEN allows tuning and forfeits that comparability, so every OPEN figure carries that label and none is ranked against CLOSED. Public result IDs are as published. Field counts are the published table as of September 1, 2026: 143 results from 19 organizations, 22 of them KV-cache. System configuration for every submission is as declared in the published system descriptions. P95 always means the max of per-rank P95s at the POSIX boundary, a worst-client bound, storage tier only. Power figures are nameplate PSU capacity only; MLPerf Storage v3.0 measures no power, and no efficiency metric is derived from nameplate ratings. Capacity figures are nominal raw TB (drive count times 122.88 TB), with df-reported usable capacity given alongside where stated; no availability class is claimed. Storage density (TB per rack unit) is FarmGPU arithmetic on the capacity and rack-unit fields of published system descriptions, covering systems that disclosed both, using FarmGPU's physical rack-unit count for our nodes; it is not a metric MLPerf Storage scores. RAID-0 provides no drive-level redundancy; it is a performance configuration only. Drive specifications and endurance figures are Solidigm spec-sheet ratings and arithmetic on them, not MLPerf measurements; MLPerf Storage v3.0 measures no endurance. Per-token KV-cache sizes are computed from the published Llama 3.1 architectures at bf16 precision. GPU token rates in the endurance section are published MLPerf Inference offline-scenario results for Llama 3.1 8B (about 18,000 tokens per second per GPU on an NVIDIA GB300 NVL72 in v5.1; about 20,000 on an HGX B200 in v6.0) and Llama 2 70B (about 13,000 per GPU in v5.1, used as the 70B-class proxy); the per-GPU division is FarmGPU arithmetic on published system totals, and MLPerf Inference is a separate benchmark from MLPerf Storage. The 888 GB/s fio figure is an informal FarmGPU lab measurement, not an MLPerf result. No comparison in this post crosses benchmark versions.
MLPerf® Storage v3.0 KV Cache: CLOSED division entries v3.0-0035, v3.0-0036 and v3.0-0037, and OPEN division entries v3.0-0142 and v3.0-0143, submitted by FarmGPU. Retrieved from https://mlcommons.org/benchmarks/storage/ on September 17, 2026. Results verified by MLCommons Association. The MLPerf name and logo are registered and unregistered trademarks of MLCommons Association in the United States and other countries. All rights reserved. Unauthorized use strictly prohibited. See www.mlcommons.org for more information.