

FarmGPU's MLPerf Storage v3.0 results, published by MLCommons in September 2026, include a WEKA NeuralMesh deployment built entirely on Solidigm D7-PS1010 TLC NVMe drives utilizing the flagship platform from Supermicro Hyper Server with AMD EPYC 9655 CPUs. We call it "Hickory." Across four CLOSED-division submissions, it is one of the 11 (org, system) pairs that ran all three MLPerf Storage v3.0 AI workload families: training, checkpointing, and KV-cache.
What We Tested
MLPerf Storage v3.0 is MLCommons' latest iteration of their AI storage benchmark. This round drew submissions from about 20 organizations, with well over a hundred published results across two divisions: CLOSED (fixed parameters, comparable across submitters) and OPEN (tuning allowed, not comparable).
FarmGPU in partnership with Solidigm and WEKA submitted across 3 major workload categories;
- Training: (we ran Unet3D) scores the simulated B200 accelerators (DLIO emulation) the storage sustains at or above 90% accelerator utilization; no physical GPUs are involved.
- Checkpointing: scores write/restore throughput and duration for a full model-plus-optimizer checkpoint.
- KV-cache: scores tokens per second sustained by the storage tier, plus read/write bandwidth.
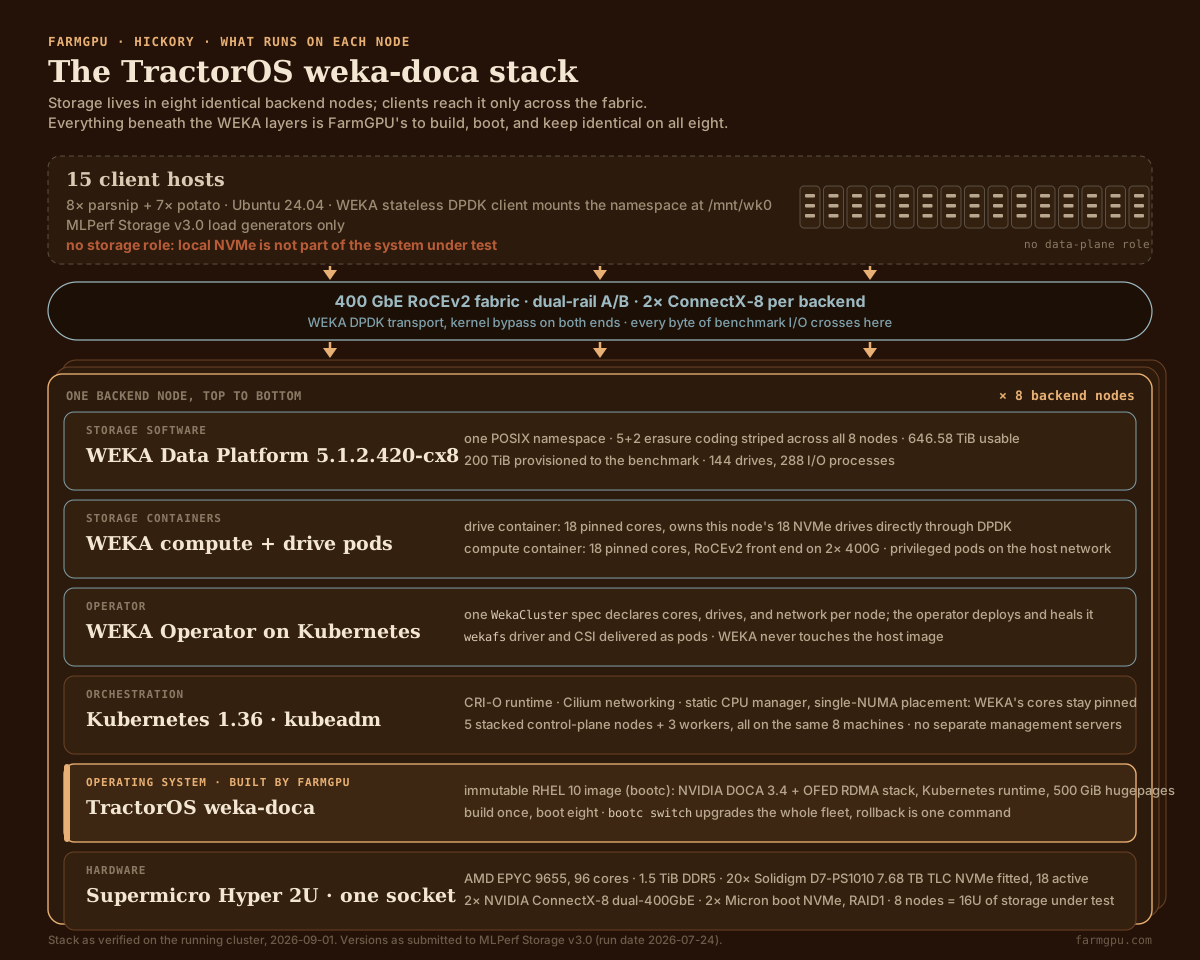
Internally, we refer to the storage cluster as "Hickory". Hickory consists of 8 dedicated backend storage nodes: AMD EPYC 9655 processors, 1.5 TiB of DRAM each, and 20 Solidigm D7-PS1010 7.68 TB TLC NVMe drives fitted per node (160 total), of which 144 (18 per node) were active and claimed by the cluster during the submitted runs: 1,106.1 TB raw. The cluster runs 5+2 erasure coding over that raw flash, yielding 646.58 TiB of usable capacity as reported by the platform; the filesystem exercised by the benchmark was provisioned at 200.0 TiB of that usable pool.
| Category | Detail |
|---|---|
| System name | hickory |
| Submitter | FarmGPU |
| Division | CLOSED |
| Benchmarks run | KVCache, Training (Unet3D), Checkpointing |
| Solution type | Shared parallel filesystem (POSIX file API), on-premises |
| Availability | Preview |
| Deployment | On-premises, bare metal; WEKA containers orchestrated on Kubernetes |
| Storage software | WEKA NeuralMesh 5.1.2.420-cx8 |
| Raw capacity | 1,106.1 TB |
| Usable capacity | 646.58 TiB (after 5+2 erasure coding, no hot spare) |
| Provisioned filesystem | 200.0 TiB of 646.58 TiB usable |
| Backend nodes | 8x 2U nodes (16 U total, storage-under-test only; clients excluded per MLPerf RU definition) |
| Backend CPU | 1x AMD EPYC 9655 (96 cores, 1 socket) per node |
| Backend memory | 1,536 GiB DDR5 installed per node (1,511 GiB available to OS) |
| Backend drives | 20x Solidigm D7-PS1010 7.68 TB TLC NVMe fitted per node (160 total); 144 active (18/node) |
| Backend networking | 2x NVIDIA ConnectX-8 dual-400GbE, RoCEv2 (dual-rail A/B) |
| Backend power | 32,000 W nameplate (8x 4,000 W); 16,000 W design power (1 active PSU/node) |
| Client hosts | 15 total: 8x "parsnip" + 7x "potato" (not part of storage under test) |
| KVCache client config | 15 hosts x 2 MPI ranks/host = 30 ranks |
| Checkpointing client config | 512 processes (TP8 x PP32 x DP2) across 15 hosts |
| Training client config | 15 hosts x 75 simulated accelerators |
| Models exercised | KVCache: llama3.1-8b, llama3.1-70b-instruct · Checkpointing: llama3-405b, llama3-1t · Training: Unet3D |
| Run date | 2026-07-24 |
WEKA NeuralMesh 5.1.2.420-cx8 presents that flash as one POSIX namespace mounted at /mnt/wk0, over a dual-rail 400GbE RoCEv2 fabric with a DPDK client transport. All storage lives in the 8 backend nodes, and every byte of benchmark I/O crosses the network to reach it. The hosts driving that I/O are 15 separate machines with no data-plane role of their own, 8 higher-memory hosts, and 7 hosts borrowed from FarmGPU's other MLPerf Storage submission. These were selected for their high performance CPUs and high speed networking capabilities to be able to generate enough of a load on the WEKA platform. Only the 8 backend nodes count toward Hickory's footprint: 16U total, with client nodes and client-side fabric switching excluded.
FarmGPU's engineering team designed this topology in conjunction with WEKA, configured the cluster, and executed four CLOSED-division benchmark submissions on 1250B checkpointing, 405B checkpointing, KV-cache, and Unet3D training.
Each backend node boots TractorOS, FarmGPU's immutable RHEL 10 image with the NVIDIA DOCA RDMA stack and a Kubernetes runtime baked in, so all eight nodes run the identical build and upgrade or roll back atomically. WEKA's operator then lands its compute and drive containers as pods on that cluster; the drive container takes the node's Solidigm drives directly, and the compute container serves the namespace over the fabric.
One Namespace, Every AI Workload
AI storage benchmarks usually score point solutions: one system tuned for ingest, another for checkpoint bursts, another for inference caching. Our submission tests whether one namespace can do all three at once.
Exactly 11 (org, system) pairs in MLPerf Storage v3.0 published CLOSED results across all three workload families. Every figure below was measured on 144 of the 160 SSDs fitted across the eight nodes, against 200 TiB of the 646.58 TiB the configuration made usable. Capacity was not the constraint on these results.
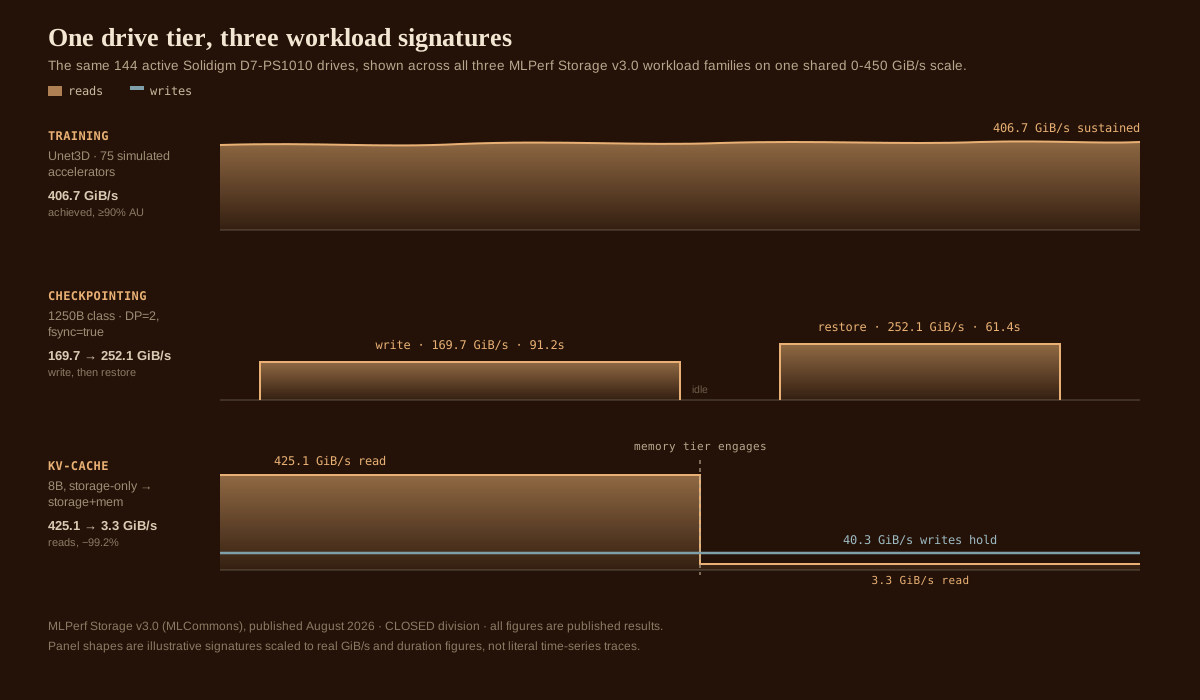
Hickory running WEKA NeuralMesh holds a top-5 CLOSED Unet3D result: 75 simulated accelerators at 406.7 GiB/s. On KV-cache, the same namespace served 26,370 tokens per second at 425.1 GiB/s of storage read.
With a memory-cache tier enabled, Hickory's shared filesystem sustains 40.3 GiB/s of cache-spill writes while a memory tier handles cache reads directly from RAM. Solidigm D7-PS1010 is serving as the persistence tier beneath a memory cache here, not the hot read path, which matches how production inference stacks are actually built.
Fifteen Clients, Not 128
Client-fleet size is an axis the field varies widely on, and Hickory posts its results with far fewer hosts driving the benchmark than the systems closest to it on throughput.
Against a hyperscale cloud provider's managed Lustre service, in its largest-scale 1250B entry (128 client VMs), Hickory's per-host throughput was 2.25x the write and 4.40x the read: 11.31 vs. 5.02 GiB/s write, 16.81 vs. 3.82 GiB/s read, from 15 on-prem hosts versus 128 cloud VMs. Absolute totals still favor the 128-VM fleet: 642.2 vs. 169.7 GiB/s write, 489.6 vs. 252.1 GiB/s read. Hickory's per-host read on this workload ranks #3 of 17, not first. The per-host read figures here carry the client-cache advisory described just below; the fsync-enforced write figures do not.
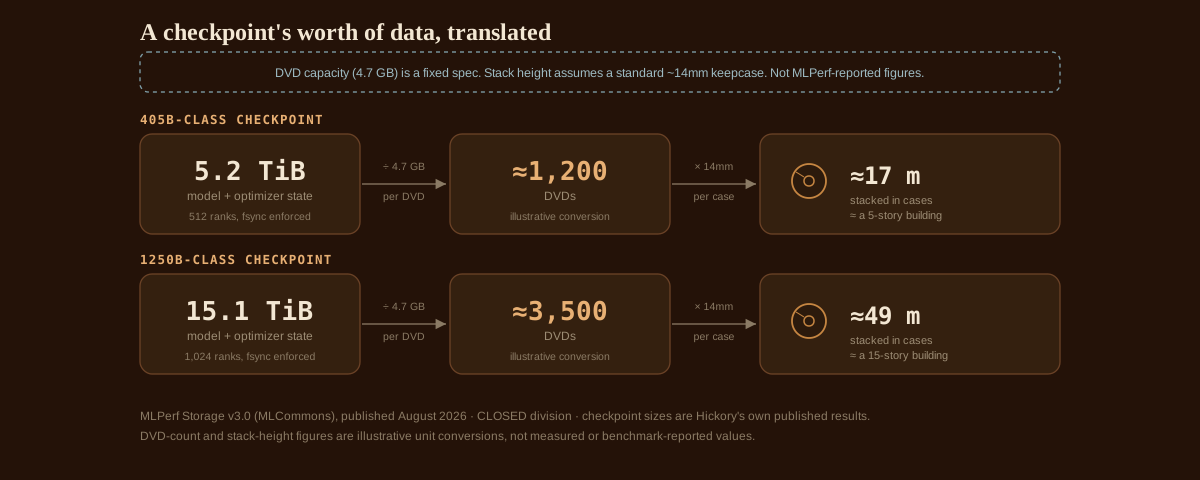
These checkpoints have a wall-clock story too. Mode Full, DP=2, 15 client hosts, fsync=true on every write. The write path is what governs operations: checkpoint frequency is chosen against how long a checkpoint stalls training. Hickory writes a 405B-class checkpoint (about 5.2 TiB of model-plus-optimizer state, 512 ranks) in 32.0s with fsync enforced on every write, and a 1250B-class checkpoint (about 15.1 TiB, 1,024 ranks) in 91.2s. Restore throughput exceeds write throughput at both scales: 283.7 GiB/s against 165.2 at 405B (restore in 19.3s), and 252.1 against 169.7 at 1250B (61.4s). Both restore figures carry the benchmark's client-cache advisory: per-host checkpoint data sits below three times client RAM, the point at which client-side caching may contribute to restore reads. The fsync-enforced write results are unaffected at either scale.
The client-efficiency pattern repeats in training: Hickory fed 75 simulated B200 accelerators at 406.7 GiB/s using 15 hosts, while that same cloud service's best entry fed 70 accelerators at 379.1 GiB/s using 70 client VMs: more accelerators and 7.3% more bandwidth from 4.67x fewer hosts. Scoped to that entry specifically (Hickory's overall Unet3D position is #5 of 42 CLOSED).
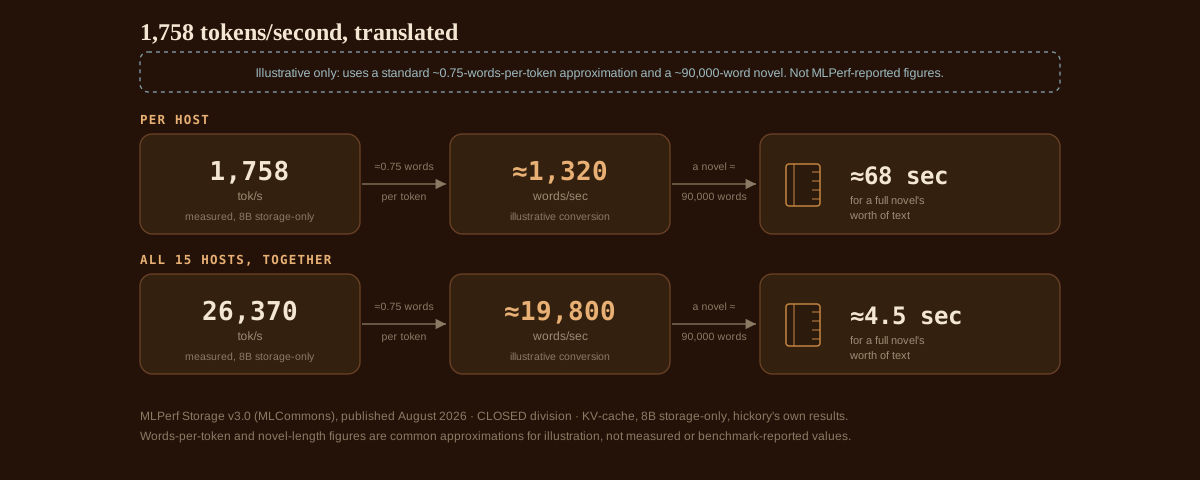
Per host, Hickory's KV-cache result is a narrower story. 26,370 tok/s aggregate across 15 hosts works out to 1,758 tok/s per host; 4.6% ahead of the field's raw-throughput leader on this workload (1,681 tok/s per host at its best), which needed 3.4x as many client hosts (51) to get there and, on the storage side, discloses no drive inventory, raw capacity, or rack-unit count. That's the one comparison where Hickory leads per host on this workload. It doesn't lead the others: a TLC storage appliance posts 3,157 tok/s per host (80% higher than Hickory), another KV-cache submission posts 2,377 (35% higher), and a similarly converged, client-local design posts 4,198 (139% higher). We are not claiming per-host leadership across the KV-cache field, only a narrow edge over the raw-throughput leader specifically, alongside a real gap behind the other three.
700+ GB/s Under FIO
MLPerf runs on rails by design: fixed parameters, fixed workloads, so results compare across submitters. We also wanted the other number. The one you get when you take the rails off, point sixteen machines at the namespace, and just pull.
So we did, together with WEKA. Sixteen client hosts, 512 readers between them, all issuing 1 MiB sequential reads against the same filesystem the benchmarks ran on. Direct I/O, so nothing hides in a page cache. Every byte came off the SSD and crossed the fabric.
The number parked itself above 700 and stayed there for three straight minutes. The aggregate across all sixteen hosts: 706 GB/s of sustained read (658 GiB/s), 674,000 IOPS, 1.52 ms average latency, 116 TiB moved in 180 seconds, zero errors. To be precise about what this is: a FIO characterization run of our own, separate from the submission. It is not an MLPerf result and it is not comparable to any MLPerf figure in this post.
All clients:
  read: IOPS=674k, BW=658Gi (706G)(116TiB/180121msec)
lat (usec): min=317, max=396410, avg=1519.01, stdev=4116.54Nothing exotic in the recipe, and that is the point. FIO 3.36: 1 MiB sequential reads, 100 percent read mix (rw=rw, rwmixread=100), direct=1 over io_uring, queue depth 2, 32 jobs per host. Sixteen hosts, eight parsnip and eight potato, 512 jobs total. Thirty seconds of ramp, then a 180 second measured window. Queue depth of two, per job. Not 64, not 256. The cluster did not need the help.
And nobody carried the run. Per host throughput landed in a tight band, 37.9 to 42.8 GiB/s, potato and parsnip alike. No hero client, no straggler dragging the average.
While it ran, we watched from the other side of the fabric. The WEKA console shows the same three minutes as the storage lived them: pure read at 707 to 715 GB/s, latency sitting around 1.4 ms, write traffic flat at zero. Two views of one event, and they agree.
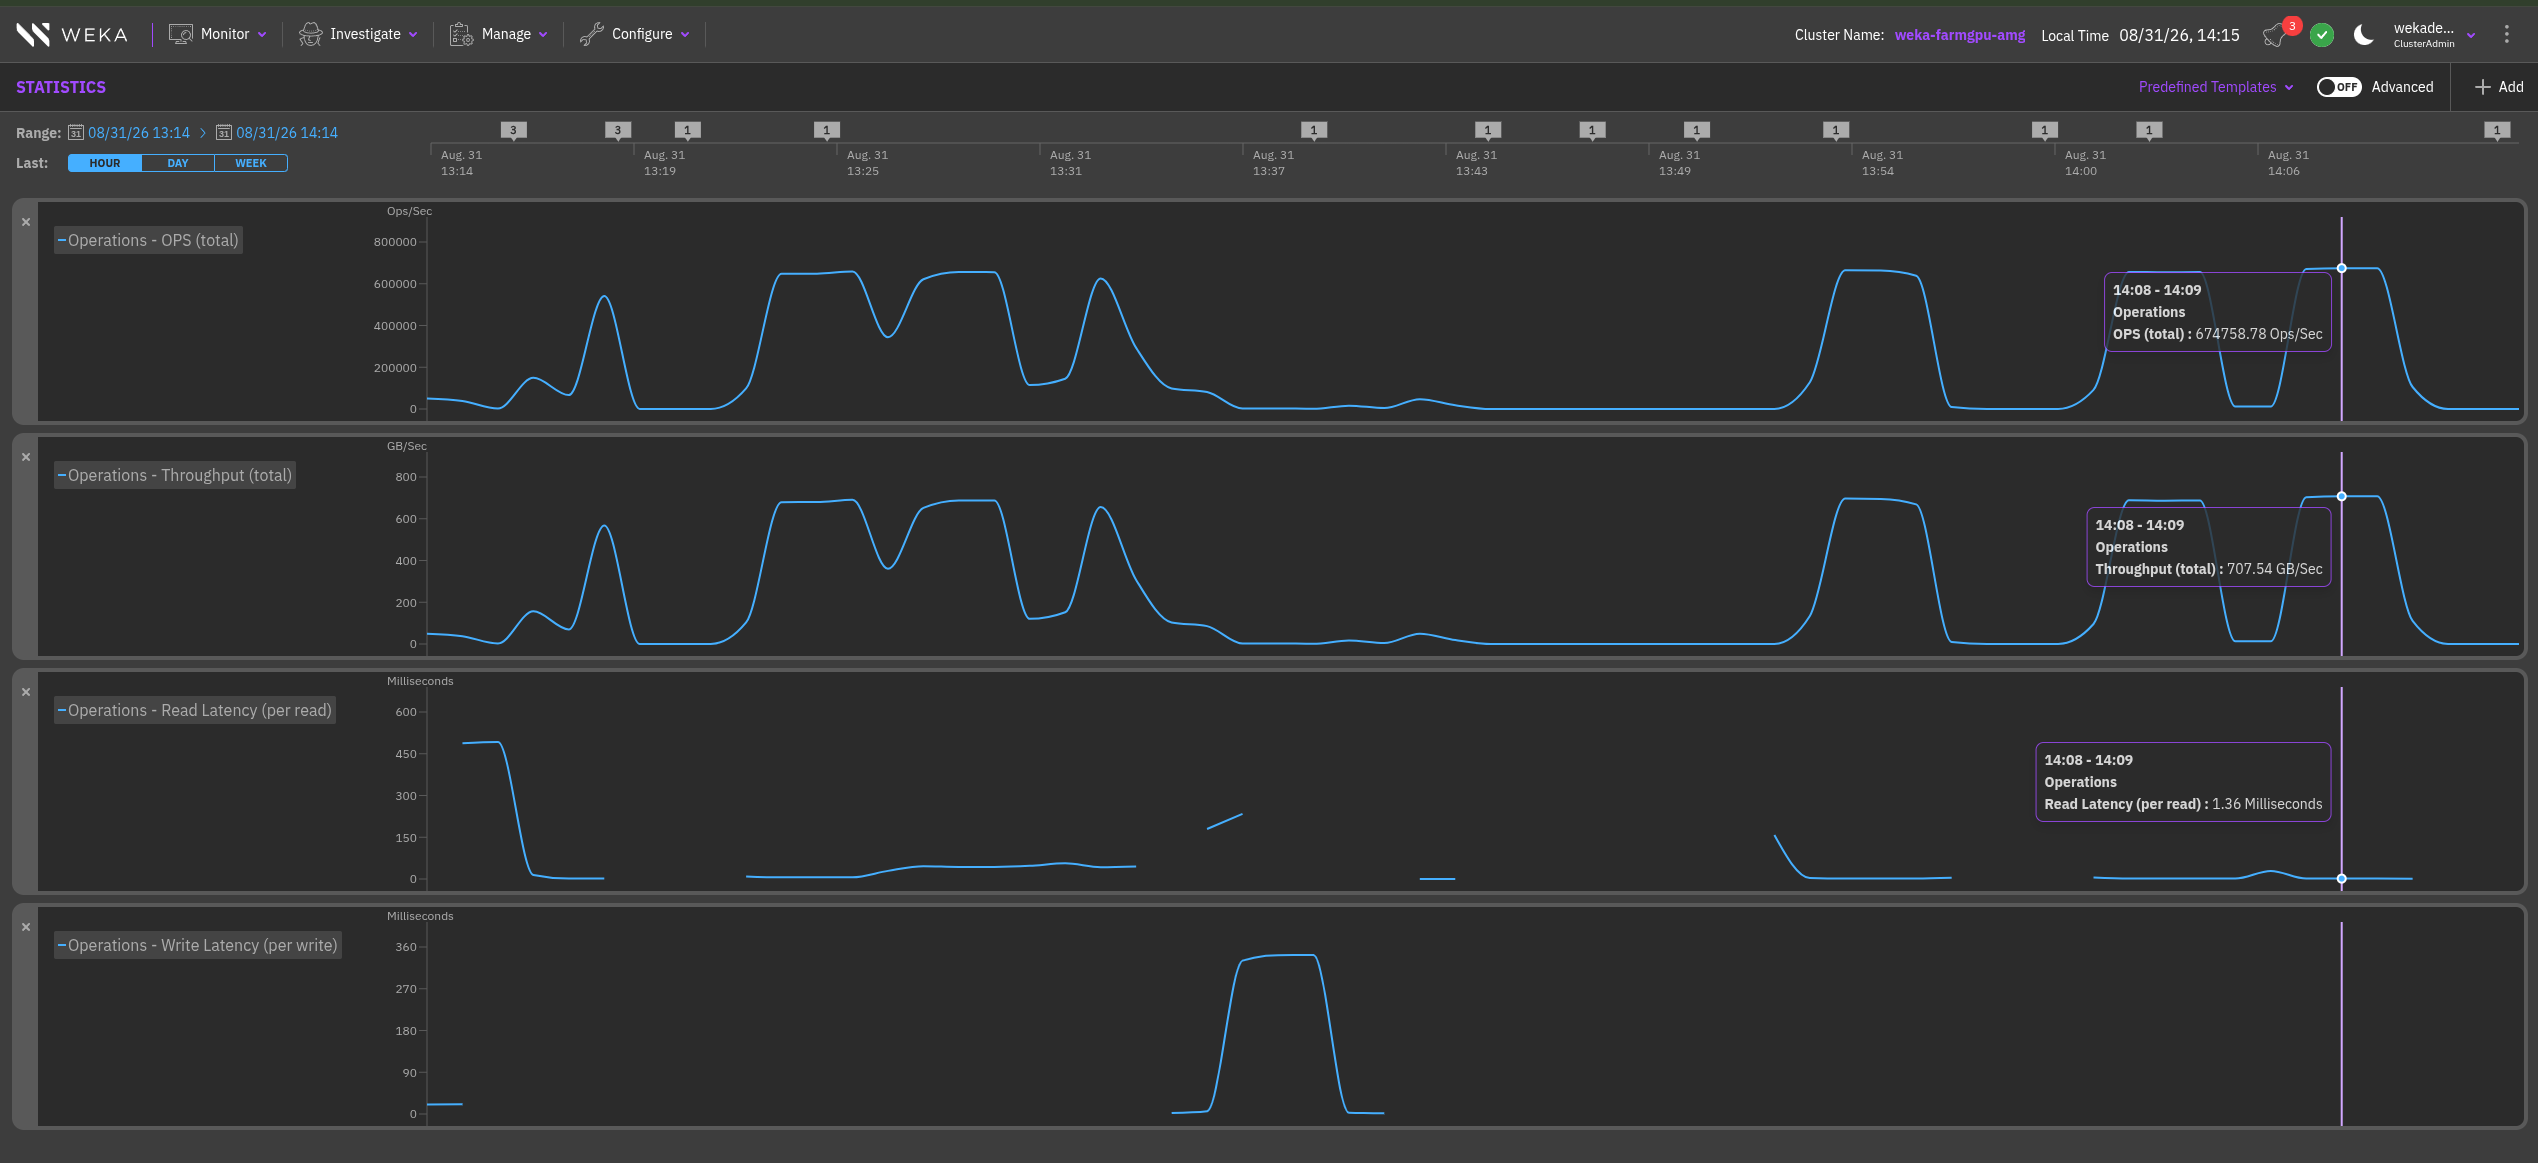
The 14:08 to 14:09 sample reads 707.54 GB/s of total throughput at 674,759 ops per second and 1.36 ms per read. The earlier plateaus in the hour are the preceding jobs in the same FIO matrix. FIO characterization traffic, not an MLPerf run.
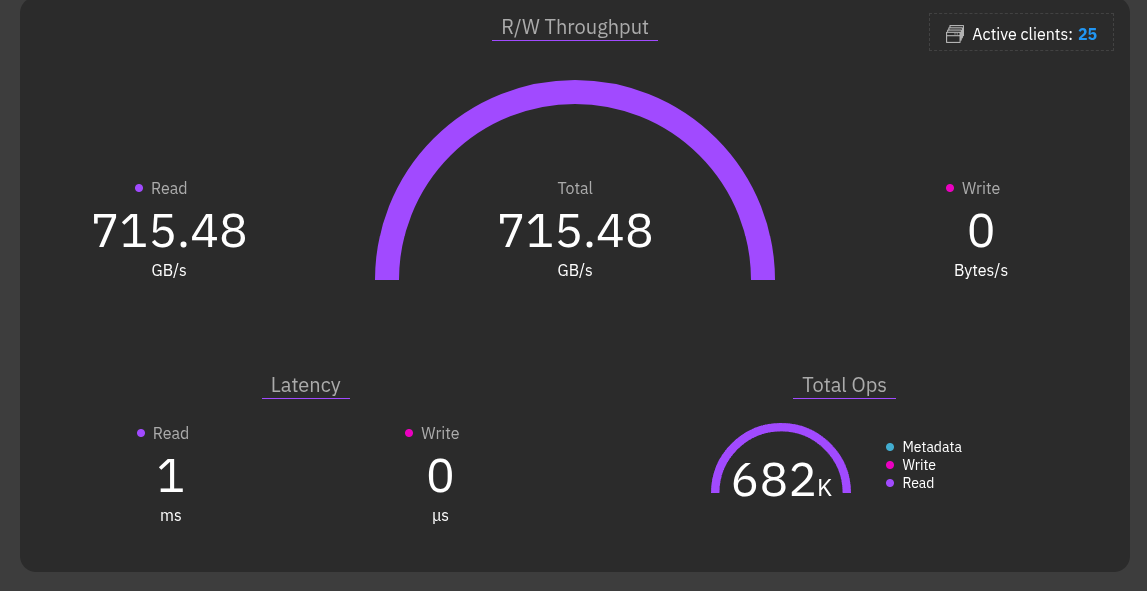
One honest footnote instead of a projection: this run used a single storage fabric, and the clients were driving only a subset of their available network ports. We are not going to guess at a bigger number. 706 is the one we measured. What matters for everything above is that nothing changed afterward: the same drives, the same erasure coding, the same namespace that held 706 GB/s of raw pull is the exact configuration that then sat for MLPerf.
One Drive Tier, Every Workload
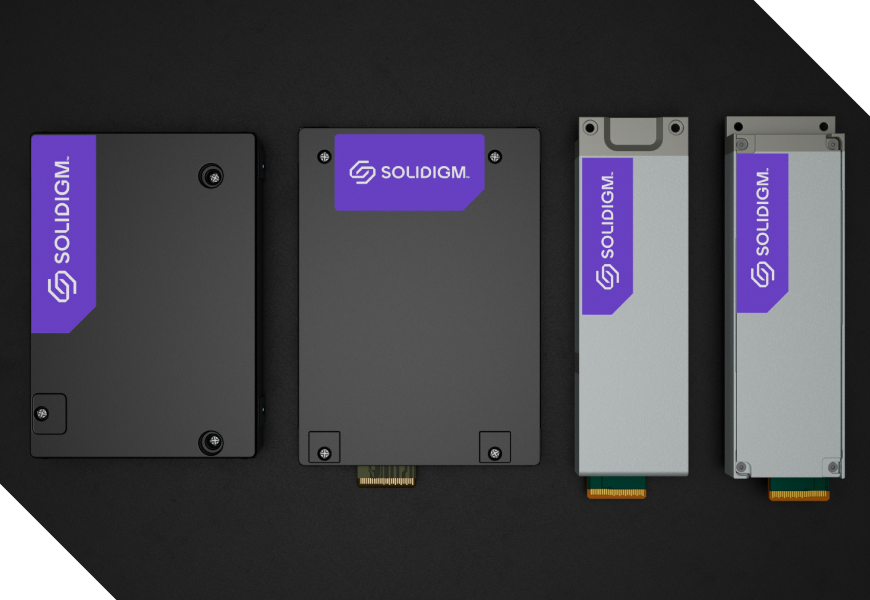
Every byte of Hickory's data capacity sits on the same Solidigm D7-PS1010 NVMe tier, entirely within the 8 backend nodes: 144 active drives, no specialized SSD for any single workload. That one tier absorbs sustained streaming reads at or above a 90% accelerator-utilization floor for training, fsync-enforced bursty writes and reads up to 169.7 GiB/s for checkpointing, and tokens-per-second cache serving with a 99.2% read-bandwidth drop for KV-cache when a memory tier sits in front of it. That tier is over a petabyte of raw Solidigm SSD — 646.58 TiB usable after 5+2 erasure coding — and the benchmark ran against 200 TiB of it.
Full results are published by MLCommons as part of MLPerf Storage v3.0 (mlcommons.org), September 2026.
A Note on Methodology
Every figure above comes from four CLOSED-division MLPerf Storage v3.0 submissions, with one exception: the FIO characterization result, which is our own measurement, labeled as such where it appears, and is not an MLPerf figure. No OPEN-division number appears in this post.
Training figures reflect simulated B200 accelerators under DLIO emulation designed by MLCommons, not physical GPUs, at or above the benchmark's 90% accelerator-utilization floor.
Capacity figures above pair raw with usable; the capacity figure in MLCommons' published results table is usable capacity, 646.58 TiB (5+2 erasure coding, no hot-spare failure domain) and its availability is listed as preview. All storage lives in the 8 dedicated backend nodes, a disaggregated deployment, not a converged one, and none of the figures above reflect measured power, since no power measurement exists for this submission.
Every per-host figure above is paired with its absolute total, since dividing by host count mechanically favors smaller fleets. Checkpoint restore figures at both scales carry the benchmark's client-cache advisory (per-host checkpoint data below three times client RAM); all write figures ran with fsync=true and are unaffected.
Comparisons in this post are drawn from published MLPerf Storage v3.0 results but do not name the other submitting organizations; where relevant, we describe the system type factually (research system, cloud service, storage appliance) instead.