Beating every major neocloud and hyperscaler with sub-1-second PyTorch imports.
Source: SemiAnalysis — ClusterMax 2.0: The Industry Standard
FarmGPU ranked #1 overall in SemiAnalysis's ClusterMax 2.0 benchmarks, outperforming every major neocloud and hyperscaler in the PyTorch import time test — the single most practical indicator of storage I/O performance for AI workloads.
The import torch benchmark is deceptively simple. It measures how long it takes to cold-import PyTorch in a fresh Python process. This exercises sequential read throughput, random read IOPS, metadata operations, and filesystem caching — all at once. Slow storage means slow imports, slow checkpoint loads, and slow data pipelines. Every second you wait is a second your GPUs sit idle.
FarmGPU's result: 0.98s on H100 and 0.72s on B200. For context, most hyperscalers clock in at 5–30 seconds on the same test.
ClusterMax 2.0 Storage Requirements
ClusterMax 2.0 evaluates GPU cloud providers across multiple categories. The Storage category tests performance, scalability, and reliability:
- Out-of-the-box parallel filesystem (e.g., Weka, DDN, VAST)
- Out-of-the-box managed S3-compatible object storage
- Storage integration with Kubernetes for PVCs/storage class
- Proper mounting configuration out-of-the-box
- Mount reliability (no random flaking on and off)
- Read performance testing
- Write performance testing
- Throughput and latency measurements
- Scalability testing for performance and capacity
FarmGPU earned top marks across the board. The key differentiator? Local NVMe storage that's properly configured from the start — we will discuss the network storage in a future post.
How We Did It
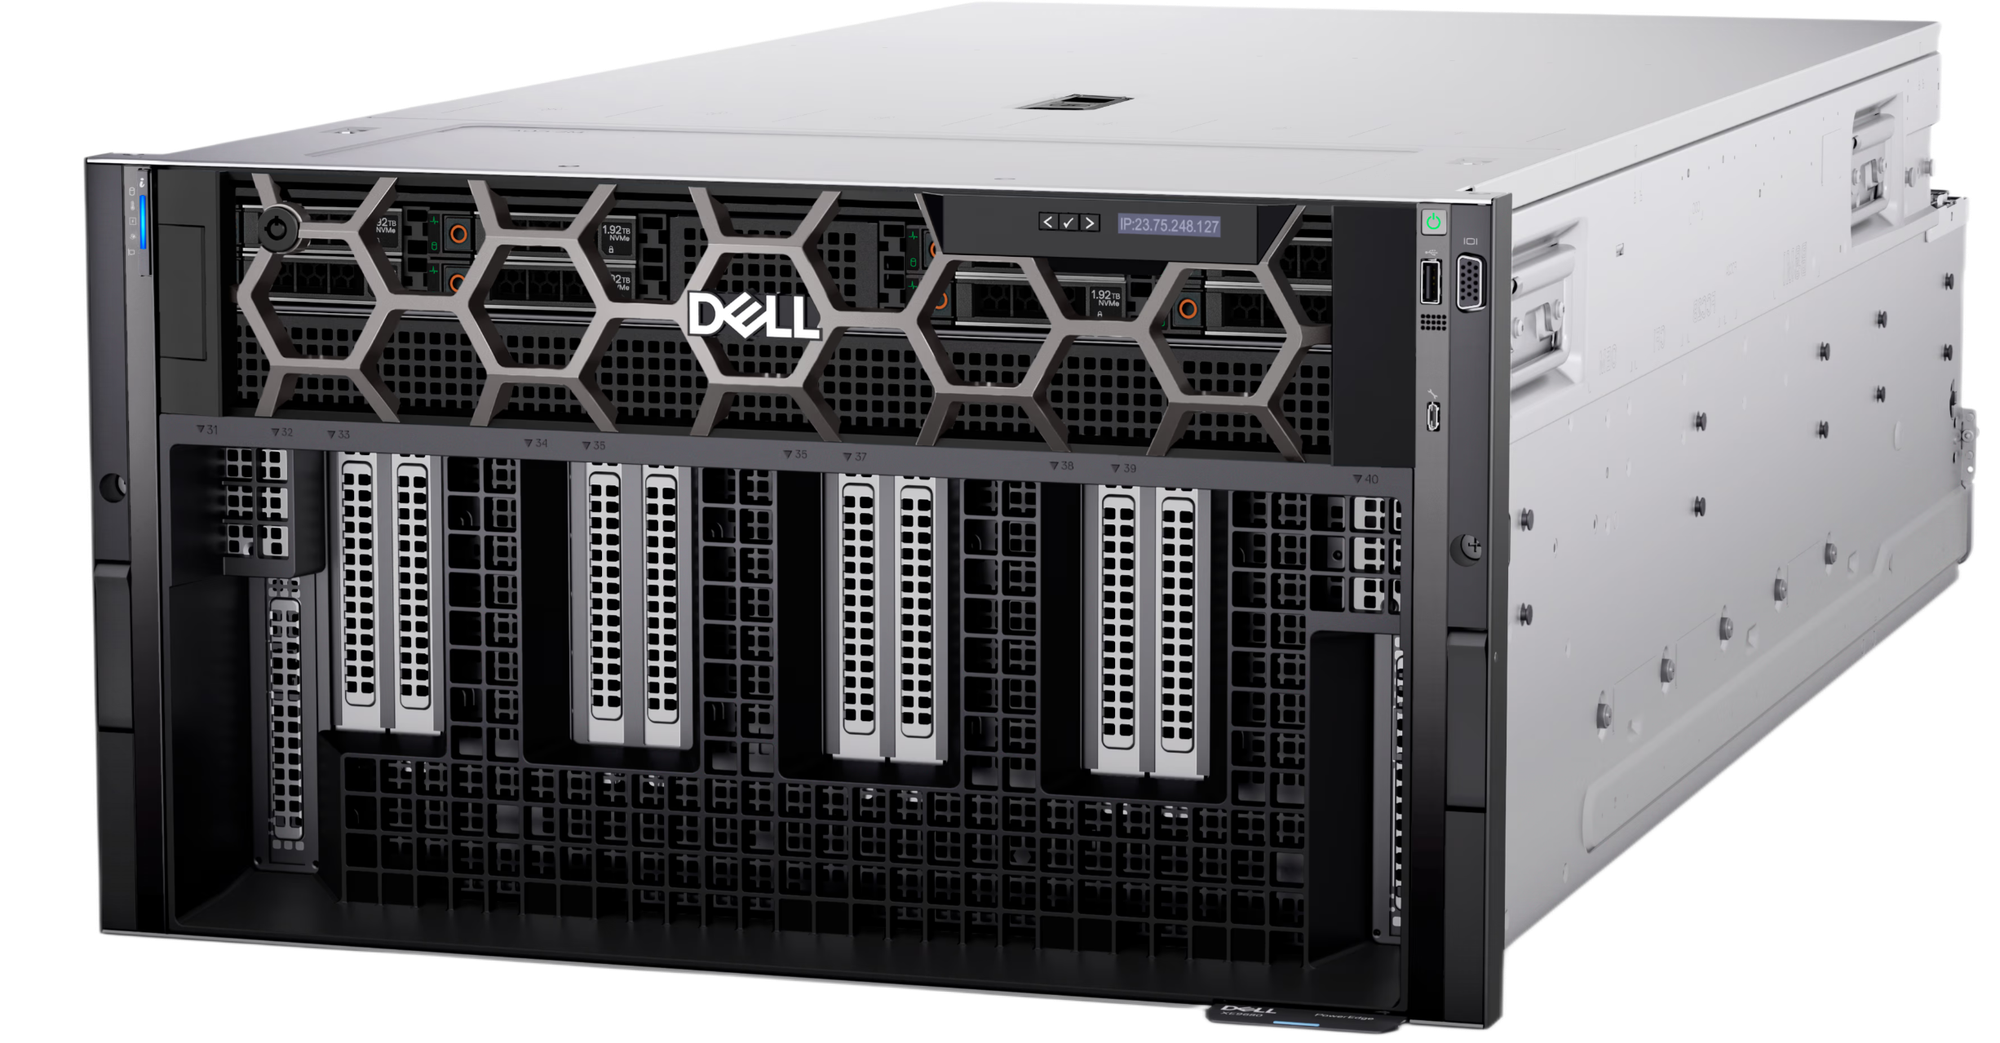
No exotic distributed filesystem. No proprietary storage appliance. Just good hardware, configured correctly:
- FarmGPU hardware — 8x Solidigm PS-1010 PCIe 5.0 NVMe SSDs per node in RAID10
- RunPod PyTorch container — Docker image with PyTorch and CUDA pre-installed
- XFS filesystem — battle-tested, high-performance, passed through to the container as
/workspace
RAID10 gives us the best of both worlds: mirrored pairs for redundancy, striped across all pairs for maximum throughput. Eight PCIe 5.0 NVMe drives in RAID10 deliver massive sequential and random I/O, far exceeding what any network-attached solution can offer at the same latency.
Every FarmGPU NVIDIA HGX server ships with this stack ready to go. No setup, no tuning, no waiting for a storage admin. You get a RunPod container with /workspace backed by the full NVMe array if you want guns blazing local NVMe RAID performance.
Benchmark Results: NVIDIA H100
System: NVIDIA H100 80GB HBM3 · Intel Xeon Platinum 8462Y+ (128 cores) · 2,015 GB RAM · 8x Dell NVMe P5520 3.84TB in RAID10 · PyTorch 2.8.0+cu128 · Ubuntu 24.04
Highlights: import torch in 0.98s · Random Read 49.55 GB/s · Seq Write 12.19 GB/s · RND4K Q1T1 Read 14.1K IOPS · RND4K Q1T1 Write 73.9K IOPS
───────────────────── FarmGPU SILO Disk Bench ─────────────────────

  Test                   Dir    Bandwidth       IOPS      Latency
  ──────────────────── ───── ──────────── ────────── ────────────
  SEQ1M Q8T1            Read    9.26 GB/s       9.3K     863.7 us
  SEQ1M Q8T1           Write   12.19 GB/s      12.2K     655.7 us
  SEQ1M Q1T1            Read    8.17 GB/s       8.2K     122.1 us
  SEQ1M Q1T1           Write    3.89 GB/s       3.9K     256.8 us
  SEQ128K Q32T1         Read   11.59 GB/s      92.7K     344.9 us
  SEQ128K Q32T1        Write    8.43 GB/s      67.4K     474.1 us
  RND128K Q128T8        Read   49.55 GB/s     396.4K      2.58 ms
  RND128K Q128T8       Write   13.81 GB/s     110.5K      9.25 ms
  RND4K Q32T16          Read   10.57 GB/s      2.71M     188.8 us
  RND4K Q32T16         Write  782.38 MB/s     200.3K      2.55 ms
  RND4K Q1T1            Read   55.07 MB/s      14.1K      70.6 us
  RND4K Q1T1           Write  288.78 MB/s      73.9K      13.2 us

  Seq Read Max:   11.59 GB/s
  Seq Write Max:  12.19 GB/s
  Rnd Read Max:   49.55 GB/s
  Rnd Write Max:  13.81 GB/s
Benchmark Results: NVIDIA B200
System: NVIDIA B200 183GB HBM3e · AMD EPYC 9555 64-Core (224 threads) · 2,267 GB RAM · 8x Solidigm PS-1010 7TB in RAID10 · PyTorch 2.8.0+cu128 · Ubuntu 24.04
Highlights: import torch in 0.72s · Random Read 100.99 GB/s · Seq Read 34.75 GB/s · RND4K Q1T1 Read 18.5K IOPS · RND4K Q1T1 Write 95.6K IOPS
Full benchmark output:
───────────────────── FarmGPU SILO Disk Bench ─────────────────────

  Test                   Dir    Bandwidth       IOPS      Latency
  ──────────────────── ───── ──────────── ────────── ────────────
  SEQ1M Q8T1            Read   34.75 GB/s      34.7K     230.0 us
  SEQ1M Q8T1           Write   30.11 GB/s      30.1K     265.5 us
  SEQ1M Q1T1            Read    4.05 GB/s       4.1K     246.6 us
  SEQ1M Q1T1           Write   10.45 GB/s      10.5K      95.4 us
  SEQ128K Q32T1         Read   25.13 GB/s     201.0K     159.0 us
  SEQ128K Q32T1        Write   16.25 GB/s     130.0K     245.9 us
  RND128K Q128T8        Read  100.99 GB/s     807.9K      1.27 ms
  RND128K Q128T8       Write   15.60 GB/s     124.8K      8.19 ms
  RND4K Q32T16          Read    6.58 GB/s      1.68M     303.8 us
  RND4K Q32T16         Write  787.89 MB/s     201.7K      2.54 ms
  RND4K Q1T1            Read   72.07 MB/s      18.5K      54.0 us
  RND4K Q1T1           Write  373.62 MB/s      95.6K      10.2 us

  Seq Read Max:   34.75 GB/s
  Seq Write Max:  30.11 GB/s
  Rnd Read Max:   100.99 GB/s
  Rnd Write Max:  15.60 GB/s
Source Code
Full source available on GitHub.
https://github.com/FarmGPU/clustermax-storage